Organization Structure
Purpose:To create a hierarchical structure of the organization, starting with a factory node, creating departments with machines in each.
The section describes:
Add Factory
Precondition: The user is logged in to the Upkip Administration through their Azure AD account.
Purpose: By selecting the Organization menu, the user can add the top node to the factory organization.
Select the menu Organization.
- The tree with organization items is opened.
Click the Add button. Select the menu Factory.
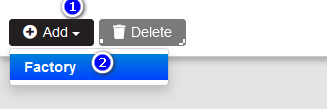
Figure 1: Organization - Add Factory
- The Add Factory form is opened.
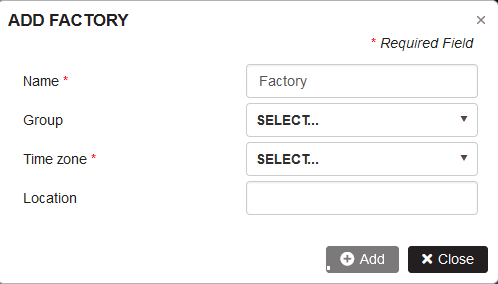
Figure 2: Organization - add factory
- Enter the Name of the factory.
- Select a Group, created in AAD related to the whole factory.
- Select a Time zone
- Provide Location coordinates in the form of 42.7067554,23.2720778 where the first number is the Latitude, and the second - Longitude
Click Add.
- The node Factory of the organization tree is created.
Add Department
Precondition: The Factory node in the organization tree is created and selected.
Purpose: It is possible to create different departments corresponding to the structure of the factory. Departments are associated with groups in Azure Active Directory (AAD). Users added to the corresponding Azure group can only see machines from the department associated with the group.
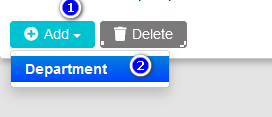
Figure 3: Organization - add department
Click the Add button. Select the menu Department.
- The Add department form is opened.
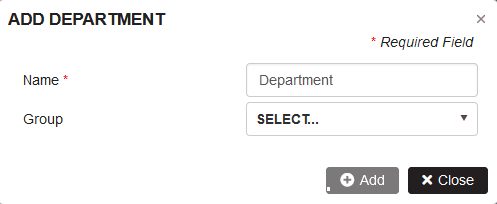
Figure 4: Organization - add department
- Enter the Name of the department
- Select Group from the dropdown menu (Groups are created in AAD)
- Click Add
- A new department is added under the Factory node.
Add Machine
Precondition: Added Factory and Department item to the organization tree. The department is selected.
Purpose: To add machines to the department from the organization.
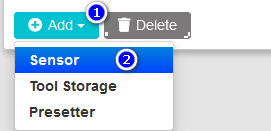
Figure 5: Organization - add sensor
Click the Add button. Select the Sensor menu.
- The Add Sensor form is opened.
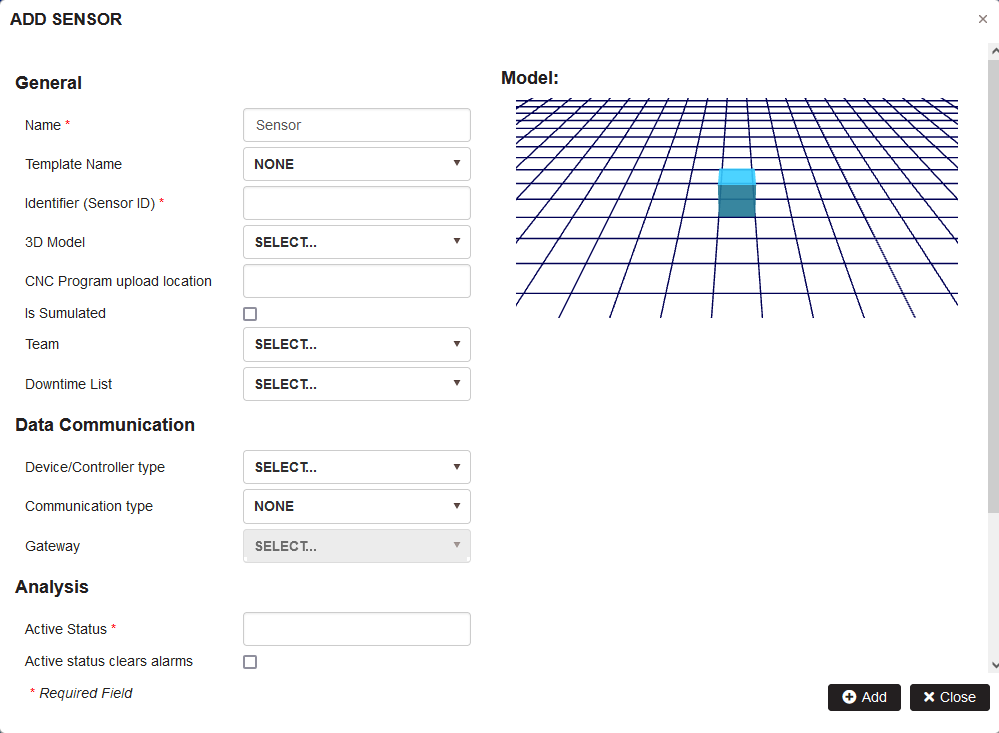
Figure 6: Organization - Add sensor properties
Fill in all machine properties and click the Add button.
- The machine appears under the department.
Delete machine
Precondition: The machine is configured in the organization tree.
Select the machine in the organization tree. Click the button Delete.
- The Delete machine warning is displayed.
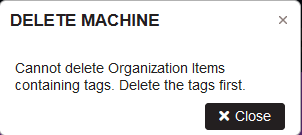
Figure 7: Delete machine warning
To delete machine from the organization first is necessary to delete all machine tags.
Go to Preview and manage tags.
Machine Properties
Precondition: The Add sensor form is opened following the steps in Add machine.
Machine properties are grouped into three groups: General, Data communication, and Analysis.
General properties
Precondition: The Add sensor form is opened following the steps in Add machine.
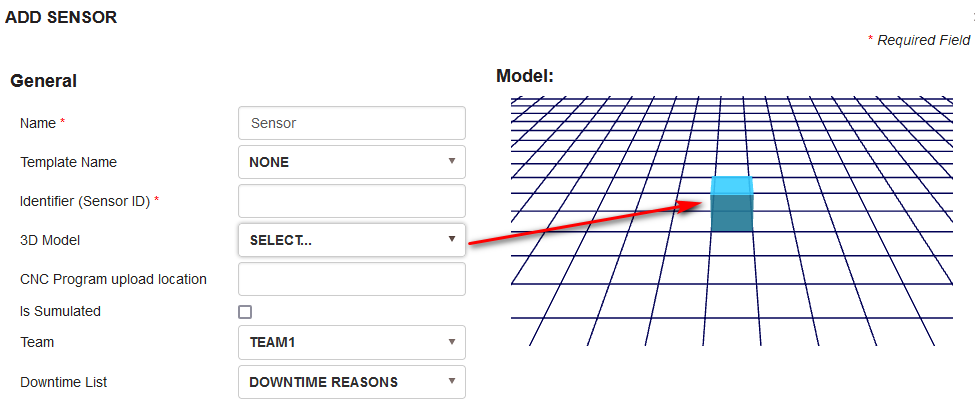
Figure 8: Add machine - general properties
Fill in the fields in the General section:
-
Name (required) – machine or sensor name, e.g. M1 - Nakamura WT-300. It is recommended that it contains the sensor ID.
-
Identifier (Sensor ID) (required) – the unique ID of the machine.
-
Template Name (optional) - It is related to the communication settings and will be described in Data Communication.
-
3D Model (optional) – select a 3D model from a predefined list of models. After selecting a 3D model from the list, it is visualized on the right side in the Model area. Some models are animated. If the model is not selected in the properties, on Factory layout shows a cube for the machine.
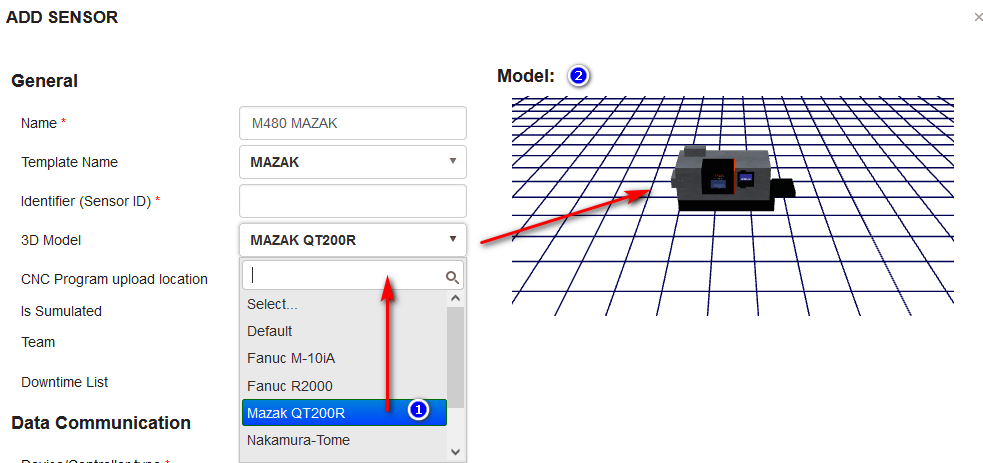
Figure 9: Add machine - seect 3D model
- CNC Program upload location (optional) – the path where the CNC program is located.
- Is Simulated (optional) - checked for testing purposes.
- Team (optional) – select from the dropdown the team in the factory.
- Downtime List (optional) – select the list with downtime reasons for the machine. The list is used in the Upkip Visualization application for adding a downtime reasons. If the list is not selected for the machine, the default Downtime list for the organization is used.
Analysis properties
Precondition: The Add sensor form is opened following the steps in Add machine.
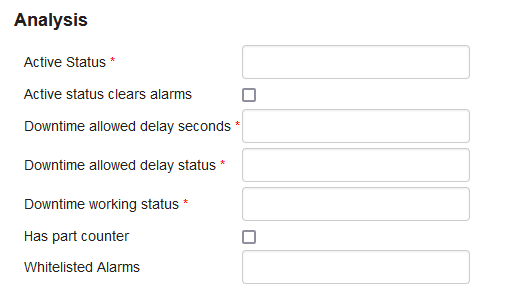
Figure 10: Add machine - analysis properties
Fill in the fields in the Analysis section:
- Active Status (required) - the comma-separated list of active machine statuses, e.g. ACTIVE,Running.
- Active Status Clears Alarms (optional)– it is checked when the machine's active status clears the alarms.
- Downtime Allowed Delay Seconds (required) - filled in with the number of seconds – e.g.60.
- Downtime Allowed Delay Status (required) – filled in with the machine's allowed delay status - e.g. IDLE
- Downtime Working Status (required) – the comma-separated list of machine downtime working statuses, e.g. ACTIVE,MACHINE OFFLINE,SYSTEM OFFLINE,MACHINE ONLINE,SYSTEM ONLINE
- Has Part Counter (optional)
- Whitelisted Alarms (optional) - the list of statuses that clear the alarms - e.g. normal,NORMAL,unavailable,UNAVAILABLE,unavailable: UNAVAILABLE,Normal,Unavailable.
Data Communication properties
To configure data communication properties and settings, go to Data Communication
Data Communication
The section describes:
- Data communication template
- Device Controller type
- Communication type
- Gateway
- Communication settings
- Update machine properties
Data communication template
Precondition: The Add sensor form is opened following the steps in Add machine.
Select a template from the Teampate Name dropdown menu in the General section.
- After selecting a template name, it is automatically loaded in the Data Communication section Device/Controller type and Communication type disabled.
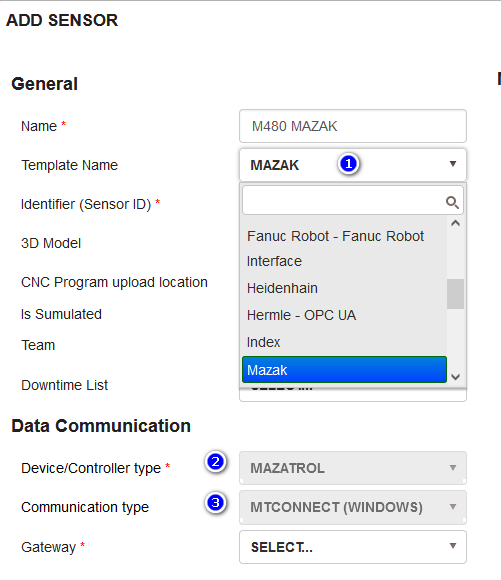
Figure 11: Add machine - select template
When you select the New option for the template name, a message is displayed prompting to select Device/Controller type and Communication type. When the machine is saved, a new template named Device/Controller type - Communication type is created, for example MAZATROL - MTCONNECT (WINDOWS).
Device Controller type
Precondition: The Add sensor form is opened following the steps in Add machine.
The user can create a new name or select from the list of already defined to label the machine/device controller type.
Selecting Add from the dropdown list opens a form to add a device/controller type name.
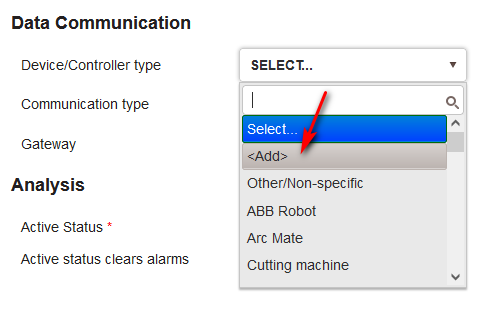
Figure 12: Select Add to add a new device/controller type
Enter name of the device/controller type, click Add.
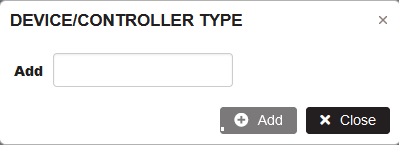
Figure 13: Add a new device/controller type
- The new device/controller type appears in the dropdown list.
Select the machine controller type from the list.
Communication type
Precondition: The Add sensor form is opened following the steps in Add machine.
Users must select a machine communication type from the dropdown list of adapters in Upkip, developed as IoT Hub IoT Device modules running on Windows or IoT Edge device modules running on Linux OS.
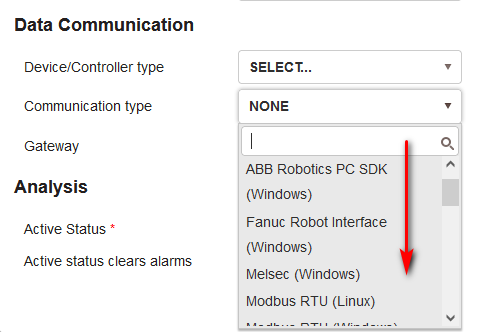
Figure 14: Select communication type
The list of supported adapters in Upkip.
| WINDOWS ADAPTERS | LINUX ADAPTERS |
|---|---|
| ABB ROBOTICS PC SDK (WINDOWS) | MODBUS TCP (LINUX) |
| FANUC ROBOT INTERFACE(WINDOWS) | MODBUS RTU (LINUX) |
| MTCONNECT HEIDENHAIN INVENTCOM (WINDOWS) | MTCONNECT (LINUX) |
| MELSEC (WINDOWS) | OPC UA (LINUX) |
| MODBUS TCP (WINDOWS) | REST(LINUX) |
| MODBUS RTU (WINDOWS) | SIEMENS S7 (LINUX) |
| MQTT (WINDOWS) | |
| MTCONNECT (WINDOWS) | |
| MTCONNECT FANUC FOCAS (WINDOWS) | |
| OPC CLASSIC (WINDOWS) | |
| OPC UA (WINDOWS) | |
| PICO DATA LOGGER (WINDOWS) | |
| PICOLOG 1000 SERIES (WINDOWS) | |
| RPC SINUMERIC (WINDOWS) | |
| SIEMENS S7 (WINDOWS) |
Note! For more details, see Adapters section.
Gateway
After selecting the machine communication type as a Windows or Linux adapter, the Gateway dropdown list is loaded with the available gateways corresponding to Windows or Linux.
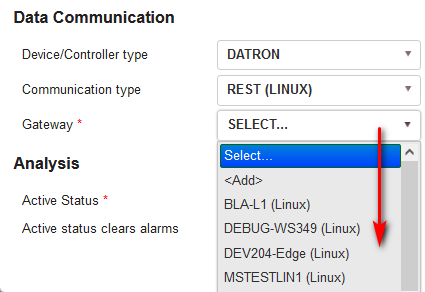
Figure 15: Select Linux gateway with Linux adapter
The user can select a gateway from the dropdown list or create a new gateway by selecting Add from the list.
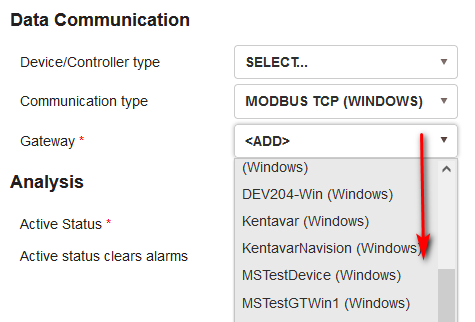
Figure 16: Select Windows gateway with Windows adapter
When Add is selected from the list, a New Gateway form is opened.
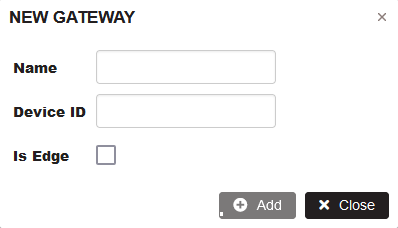
Figure 17: Add new gateway
Fill in gateway details.
- Name (the gateway name in the Upkip gateway list).
- Device ID (the gateway name in IoT Hub).
- Is Edge.
- If unchecked, a gateway will be created as an IoT Hub Device (running on Windows).
- If checked, a gateway will be created a gateway as an IoT Hub Edge device (running on Linux).
Click the Add button.
- The new gateway is created in Azure IoT Hub and appears in the list.
Note! When you create a Linux gateway, additional custom gateway deployment must be done to make it usable. Ask the platform administrators for further information.
When all the required data in the machine properties form is filled in, click the Add button.
- The machine is added to the selected department with their properties.
Communication settings
Precondition: The machine has been added to some department with their properties.
Select the added machine in the organization tree. Click the Properties tab.
- The machine Properties form opens.
- On the right side Data Communication Settings related to the selected Communication Type and Gateway are displayed.
In the Data Communication Settings, a predefined set of fields for user-configurable settings appears based on the adapter type. The settings are sufficient for normal communication with the machine.
Before some fields there is an information icon (“i” sign). Hover the icon, a tooltip is displayed explaining the format of the field data. For other fields without an information icon and tooltip, the field label is sufficient to inform the user about the format of the field data (e.g. port, IP Address, etc.).
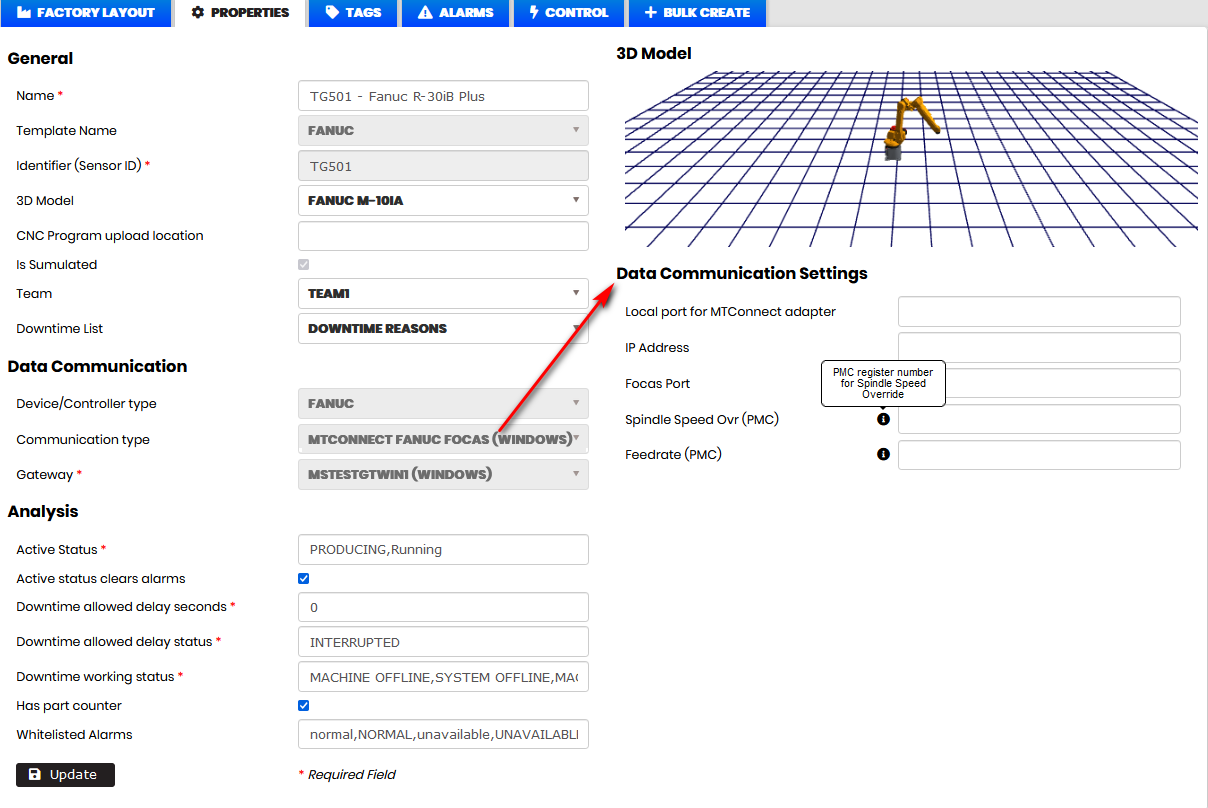
Figure 18: Machine properties with data communication settings
Fill in the data communication settings fields with the requested machine communication data. Click the Update button.
- A module related to the communication type is created in the gateway.
- Machine communication data is sent and updatged in the gateway module.
For example, if the machine has an adapter type SIEMENS S7 (WINDOWS). Fill in the machine communication data and click Update.
- Machine data is sent and updated to the gateway module.
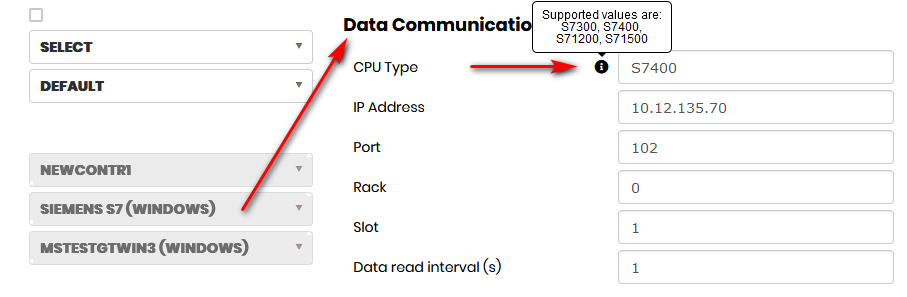
Figure 19: Machine communication settings for SIEMENS S7 (WINDOWS)
Select the GATEWAYS menu, select the machine gateway and click the Modules tab. Select a Siemens S7 module.
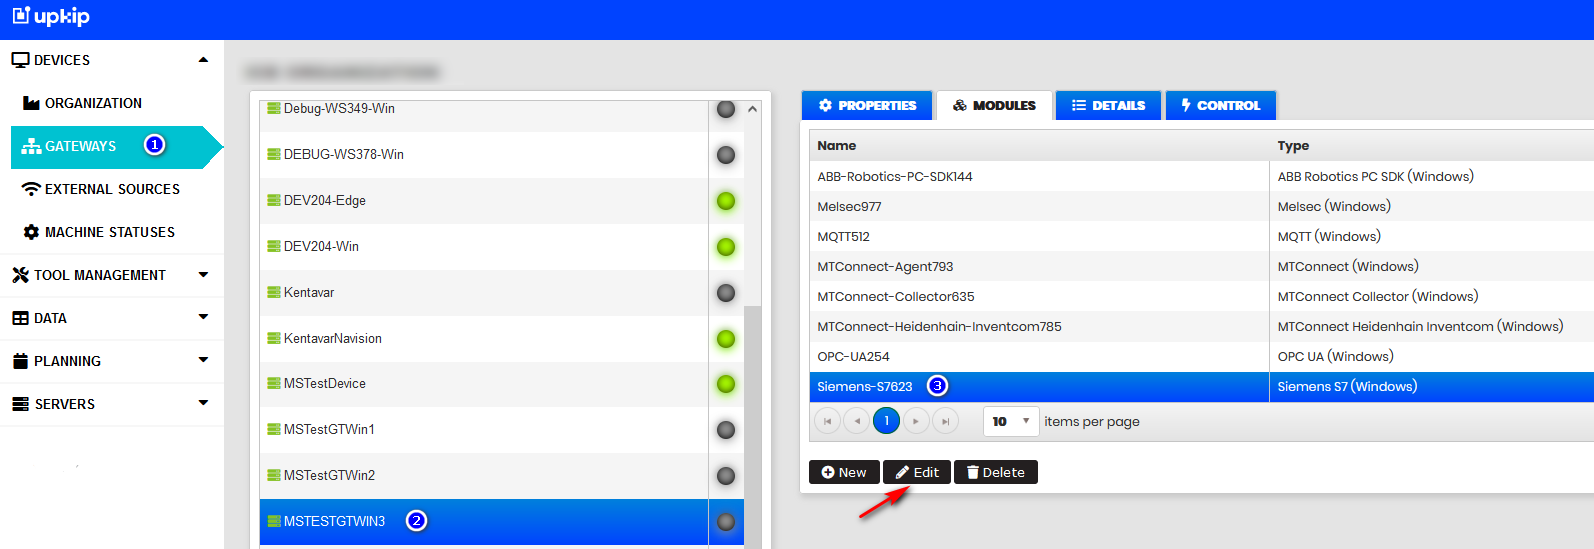
Figure 20: Gateway module with machine configuration
Click the Edit button.
- The Edit module form opens. In the module Desired configuration, the machine configuration settings data is added or updated in a JSON value.
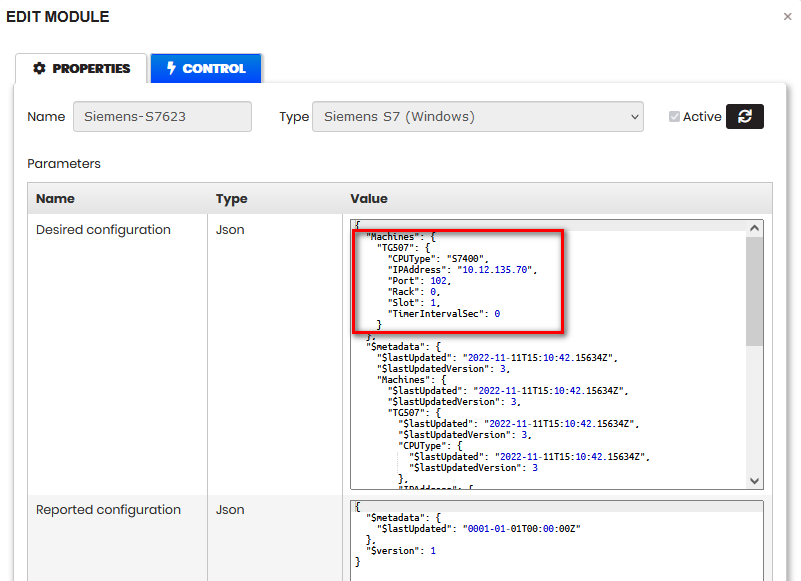
Figure 21: Gateway module with machine configuration data
For example, if the machine has adapter type ABB ROBOTICS PC SDK (WINDOWS) with filled communication data.
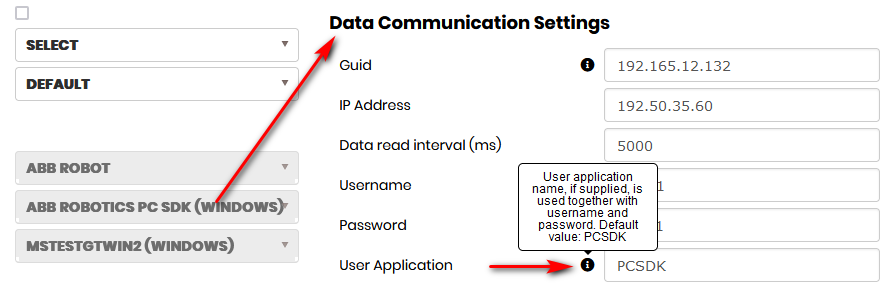
Figure 22: Machine communication settings
- After clicking Update for the machine properties, the module is created (or updated) in the selected gateway.
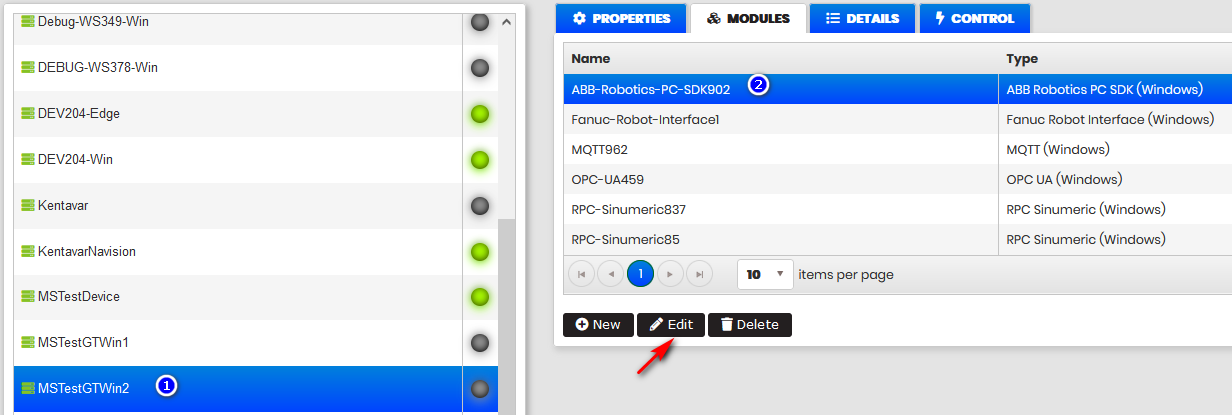
Figure 23: Gateway module with machine configuration
Click the Edit button.
- The Edit module form opens. In the module Desired configuration, the machine configuration settings data is added or updated in a JSON value.
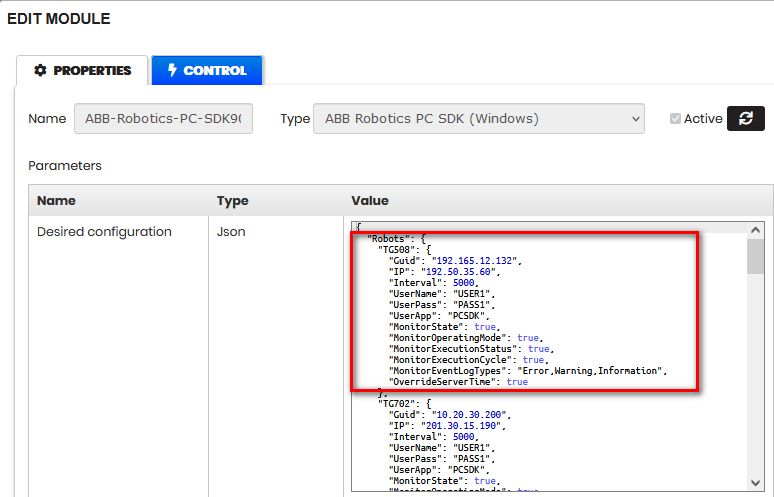
Figure 24: Gateway module with machine configuration
Note! For more details, see Adapters section.
Update Machine Properties
Precondition: The machine is configured in the organization tree.
Select the machine in the organization tree. Select tab Properties.
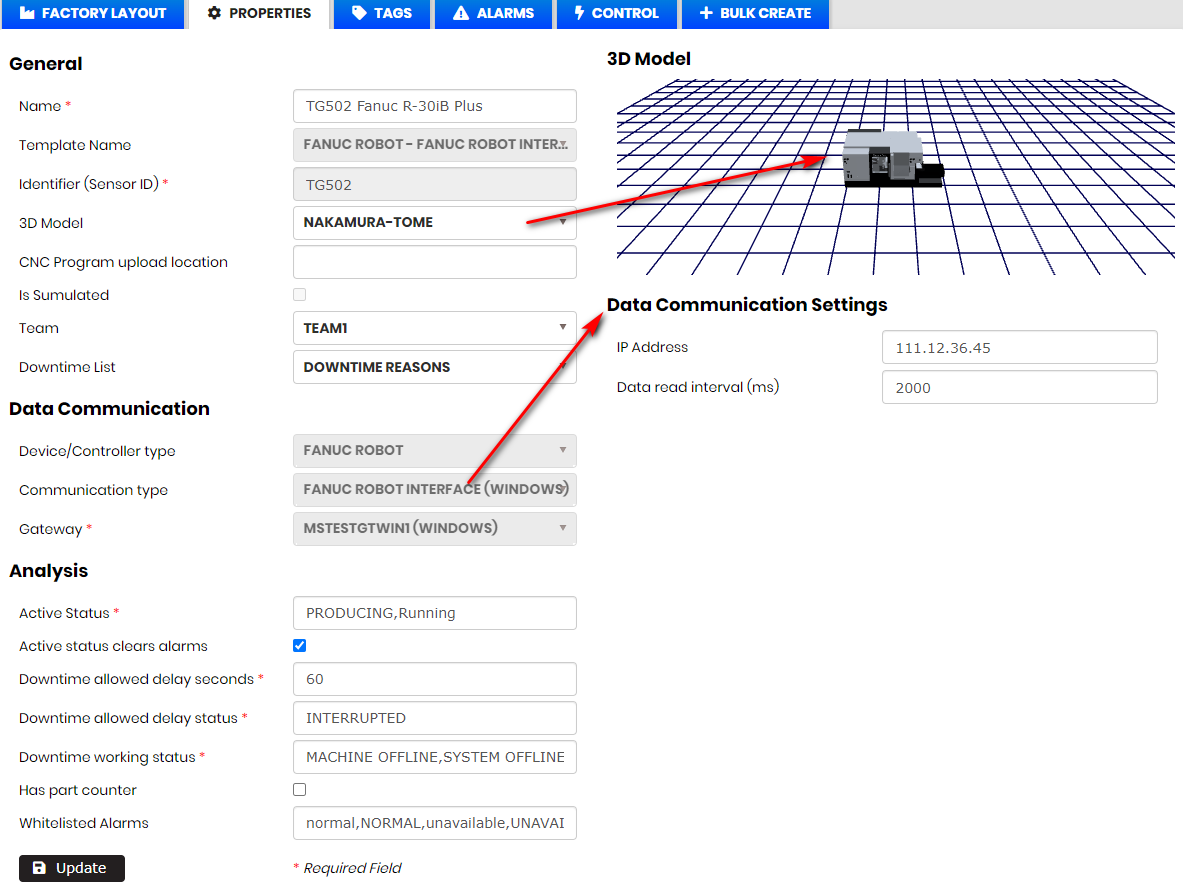
Figure 25 Update machine properties and communication settings data
The user can view or edit the editable properties. After changing some properties or data communication settings click the Update button.
- The machine properties are updated.
- The machine communication settings are sent to the gateway module for the corresponding adapter and added or updated in the JSON value of the module.
Machine Tags
Purpose: Machine tags are used for receiving data from the machine. Received data is analyzed and used for visualization in different dashboards presented by user-friendly view. In the section are described functionalities:
- Machine Tags
- Edit Tag
- Add Tag
- Add Tag type with a specific adapter configuration
- Add tag to all machine with the same template
- Add Tag with external sensor
- Import tags from file
- Delete Tag
- Preview and manage tags
- Write tags to gateway
- Tags Browser
Machine Tags
Precondition: The machine is selected in the organization tree. Select tab TAGS.
- The list with configured tags for the machine is opened.
- For each tag is shown: ID, Name, Type, Payload, Display Name, Script, and Source
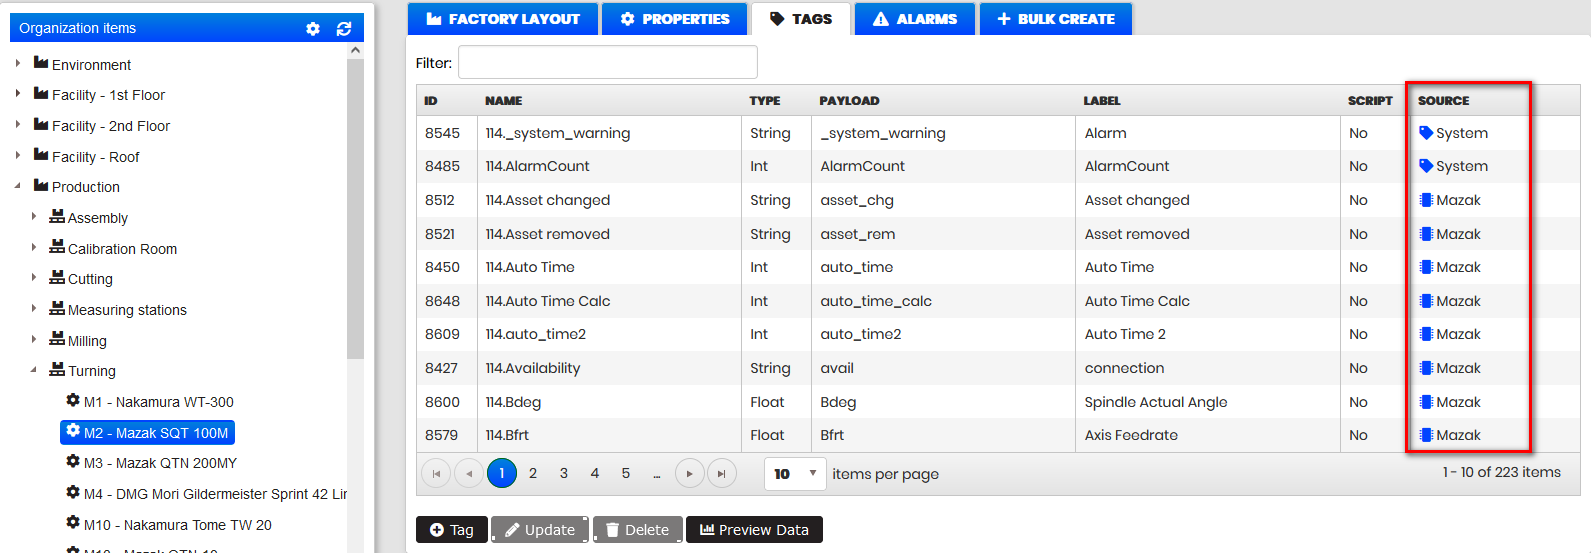
Figure 11: Machine tags - sources
Source of the tag indicates tag origin with specific icon before description:
- Machine type – the supported machine types are: Fanuc, Mazak, Heidenhain, Datron, Fanuc Robot, Deburring cell, UR Nakamura Cell, Robotic Cell.
- System - system tags are common tags for all machine types.
- External sensors - this appears for tags connected to external sensors. Supported types of external sensors are Disruptive technologies, ReMoni, El-Watch, Neuron sensors, NCD sensors, Weather data.
Filtering machine tags – machine tags can be filtered by typing in the filter field.
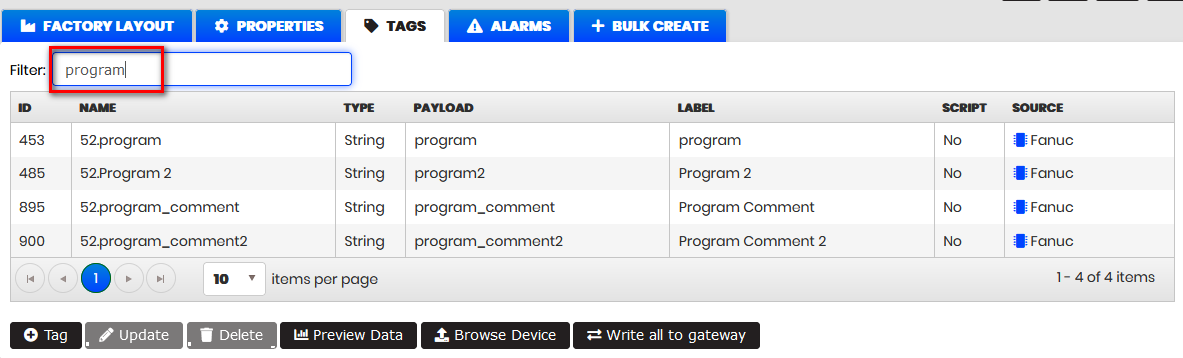
Figure 12: Machine tags - filtering the tags
- Only tags containing in the name, payload, display name typed text are shown.
Created alarms for tags are indicated with an icon in the first column after the Tag ID.
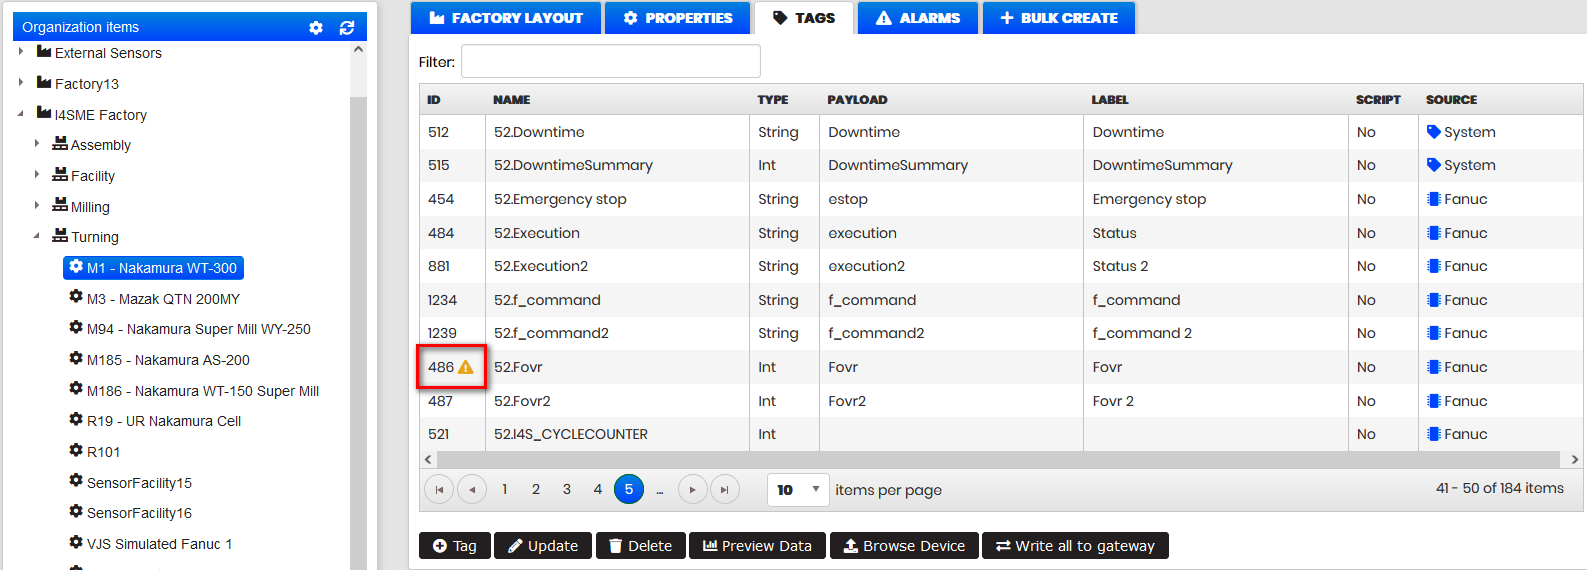
Figure 13: Machine tags - icon for created alarms from tag
Edit Tag
Precondition: The machine is selected in the organization tree. Select tab TAGS.
- The list of configured tags for the machine is opened.
Select some tag and click Update.
- The Edit tag form is opened.
Tag with value type String has the following data:
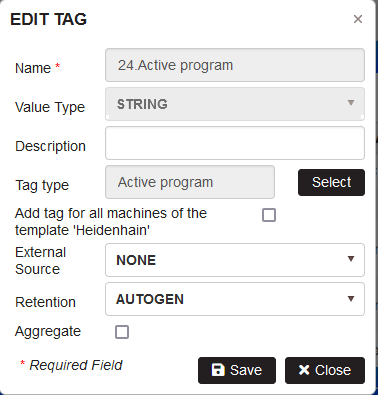
Figure 14:Machine - tags -edit tag
- Tag Name (required) – must be unique.
- Value Type (required) – value type – String, Int, Float.
- Description (optional) – description of the tag.
- Tag Type – select from available.
- External source – select None or some type of external sensors from the dropdown list.
Tag of type INT or Float has 3 additional fields – Min, Max, and Set Point.
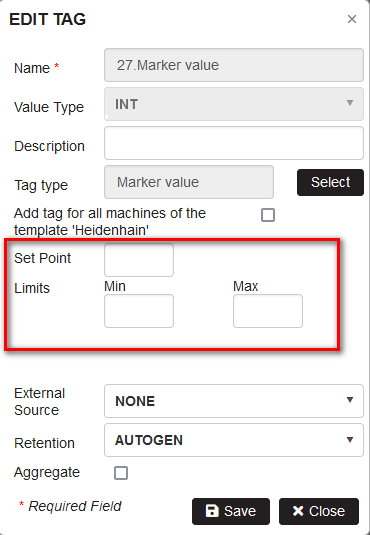
Figure 15: Upkip Administration -Edit machine - Add new tag Min and Max limits
Min/Max fields are used to enter integers/floats for minimal and maximal value.
Set Point is used to enter the optimal value as integer/float.
Min and/or Max values can be used to create warnings for them following the steps Create Warnings from Tag Limits
Add Tag
Precondition: The machine is selected in the organization tree. Select tab TAGS.
- The list of machine tags is shown
To add new tag click the Tag button.
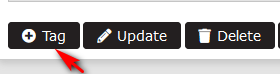
Figure 16: Machine - Tags - Add new tag
- The New tag form is opened.
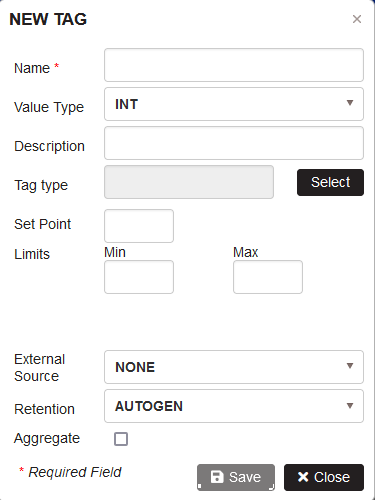
Figure 17: Machine - Tags - Add new tag
- Select Value Type - Int, Float or String.
- Click the button Select to select a Tag Type.
- The form Tag type is opened.
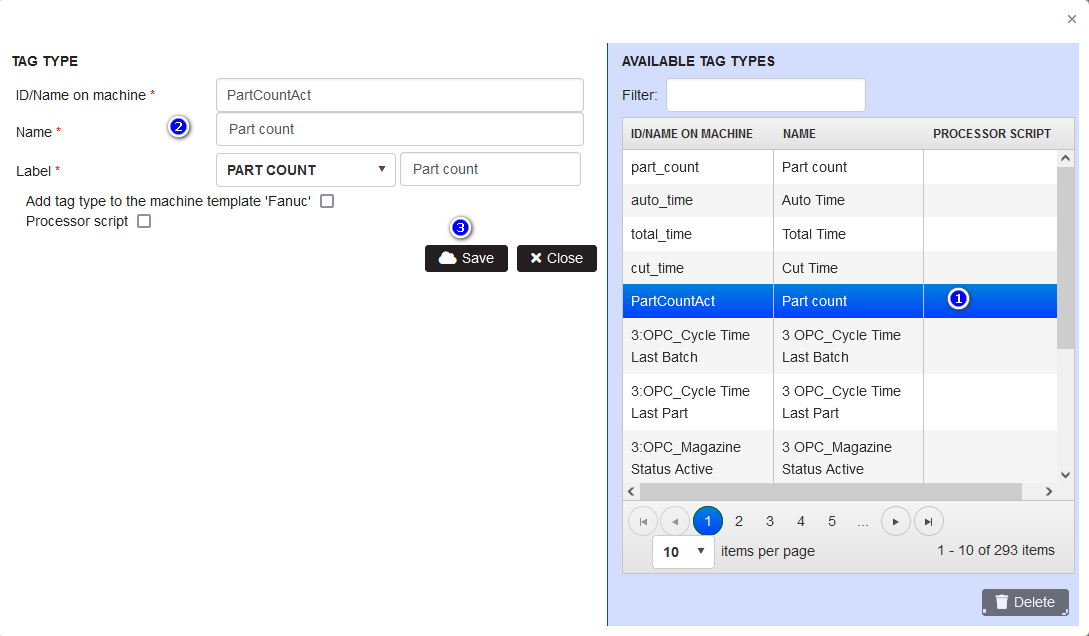 Figure 18: Add tag - select tag type
- Filter and select some tag type (1).
- The fields ID/Name on machine, Name and Label are filled from the selected tag
- Click the Save button.
- Selected tag type is filled in the New tag form.
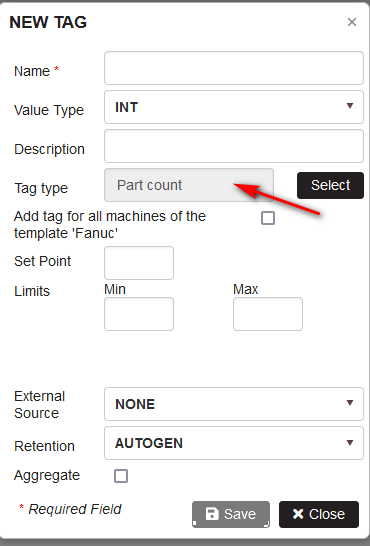
Figure 19: Add tag with selected tag type
Fill in the Name with tag name and Description (optional) and click Save.
- The new tag appears in the machine TAGS list.
Add Tag type with a specific adapter configuration
Precondition: The machine is configured in the organization tree.
Select the machine in the organization tree. Select tab TAGS.
Follow to steps in Add Tag to select Tag type.
When creating a tag and adding a tag type, depending on the machine's communication type, additional settings may appear.
For example, when adding a tag to a machine with Modbus communication adapter, additional settings may appear. There is an information icon for each field. Hover the icon, a tooltip appears explaining the format of the data in the field.
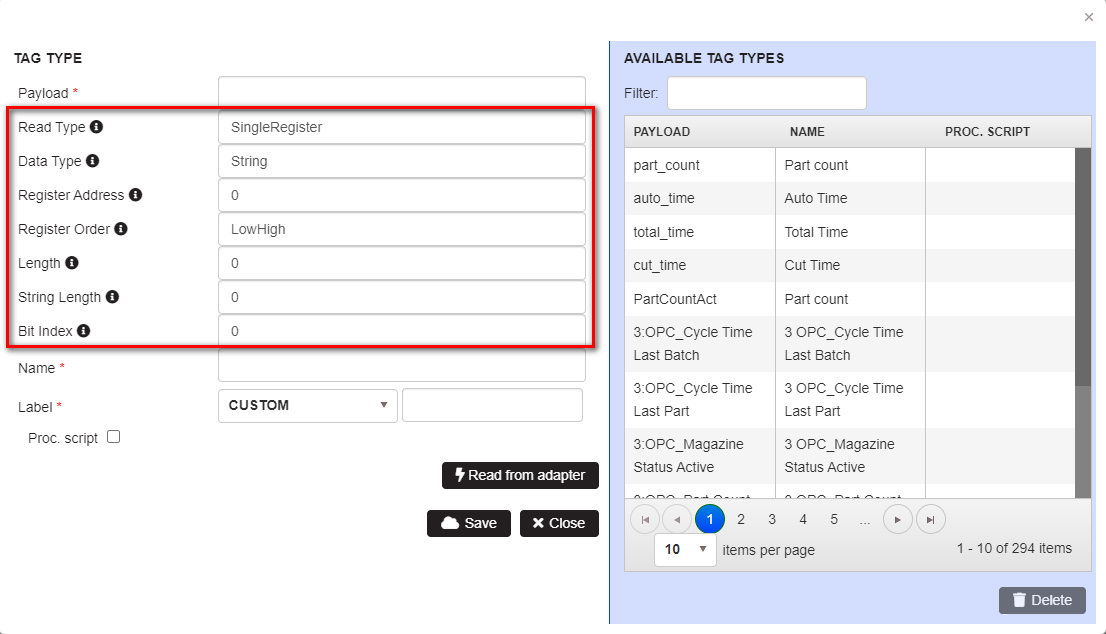
Figure 20: Select tag type with additional adapter configuration
Add Tag to all machines with the same template
Precondition: The machine is selected in the organization tree. Select tab TAGS.
To add a new tag click the Tag button.
- The New tag form is opened.
Select a new tag type.
- The tag type is loaded in the form.
- Select the checkbox Add tag for all machines of the template 'Mazatrol - MTConnect'
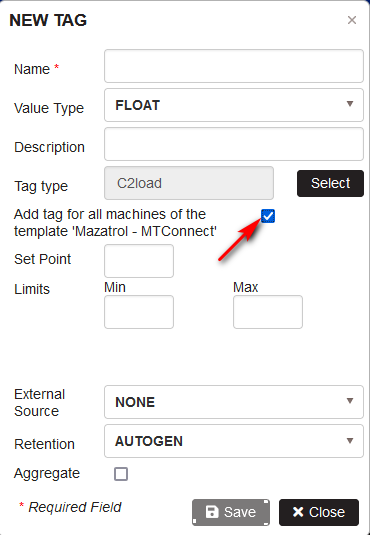
Figure 21: Add tag to all machines with the same template
Fill in the Name with tag name and Description (optional) and click Save.
- The warning is shown.
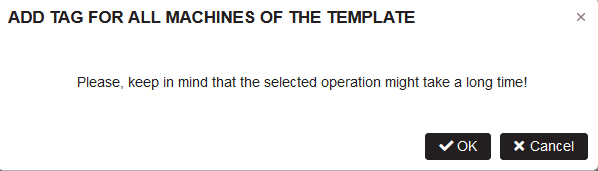
Figure 22: Add tag to all machines with the same template message
Click the OK.
- The added new tag is added also to all machines with the same template.
Add Tag with External sensor
Precondition: The machine is selected in the organization tree. Select tab TAGS.
- The list with machine tags is shown
The external sensors can be connected to:
- Machine tags to measure different temperatures related to the machine: coolant, motor, body, spindle, cooling pump etc., vibration and power.
- Rooms tags to measure temperature, door sensor, weather, etc.
Data received from the external sensors are visualized as charts showing min, max, average values, and current values.
Upkip supports external sensors of the following types:
How to install external sensors is described in the documentаtion Installer support/External sensors setup
To configure tag with external sensor open menu Organization. Select the machine. Open Tags. Find the tags connected with external sensors by filtering.
- The tags connected to external sensors are filtered.
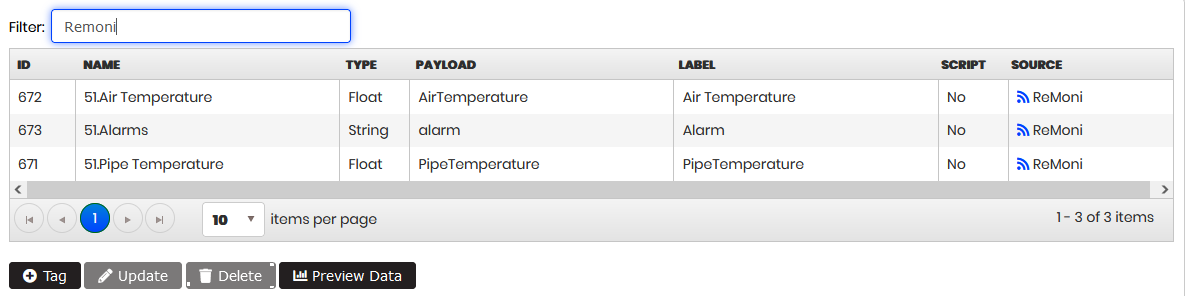
Figure 23: Machine tags - external sensors connected to machine tags
Click Tag button to create a new tag.
- The New Tag form is opened
Select tag type related to value type, add Name.
Select type of the external source (sensors) from the dropdown list.
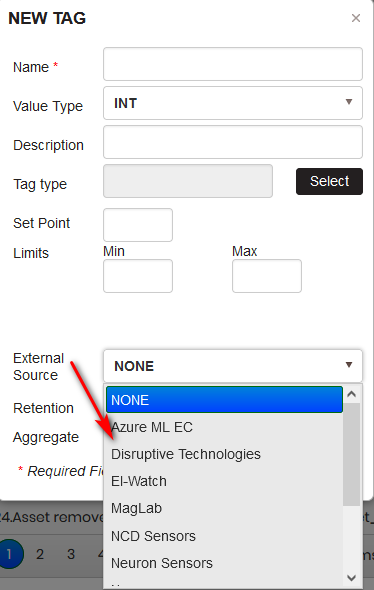
Figure 24: Machine - new tag – select external sensor type
In addition to fields described in the Add Tag section tags connected to external sensors have attributes:
- External Source – selected external source from the list of supported types – ReMoni, Disruptive Technologies, El-Watch, Azure ML LC, Weather, Neuron Sensors, NCD Sensors.
- External type - Data or Alarm.
When selecting type of the external sensor additional fields are shown for configuration.
Configuration of tag with ReMoni sensor
Precondition: The New tag form is opened. Filled in the tag name and tag type.
Select from the External source dropdown the type of the external sensor - ReMoni.
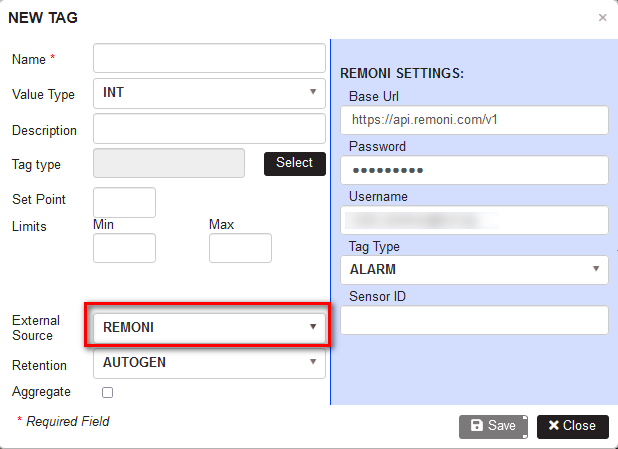
Figure 25: Add tag - external sensor ReMoni configuration
After selecting type of the external sensor, fill in base URL with username and password.
Select external type – Data or Alarm. Fill in Sensor ID.
When Data is selected additional fields for Aggregate type, Channel number, and Data type have to be filled in.
After saving the tag with an external sensor in the column Source of the tags list is shown ReMoni .

Figure 26: Tag with ReMoni sensor
For more details go to ReMoni sensors configuration
Configuration of tag with Disruptive technologies sensor
Precondition: The New tag form is opened. Filled in the tag name and tag type.
Select from the External source dropdown the type of the external sensor – Disruptive technologies.
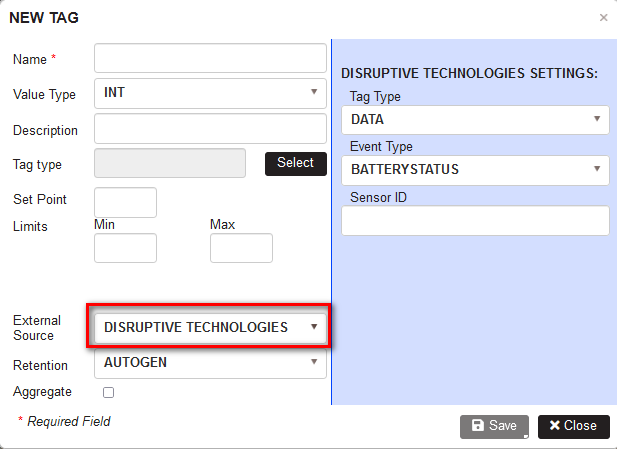
Figure 27: Add Tag - external sensor Disruptive technologies configuration
Select Tag type Data. Select Event type from the list and fill in Sensor ID.
After saving the tag with an external sensor in the column Source of the tags list is shown Disruptive technologies.

Figure 28: Tag with Disruptive technology sensor
For more details go to Distuptive technoloty sensors configuration
Configuration of tag with El-Watch sensor
Precondition: The New tag form is opened. Filled in the tag name and tag type.
Select from the External source dropdown the type of the external sensor – El-Watch.
Fill in the fields API Key, Base URL, Data type and Sensor ID.
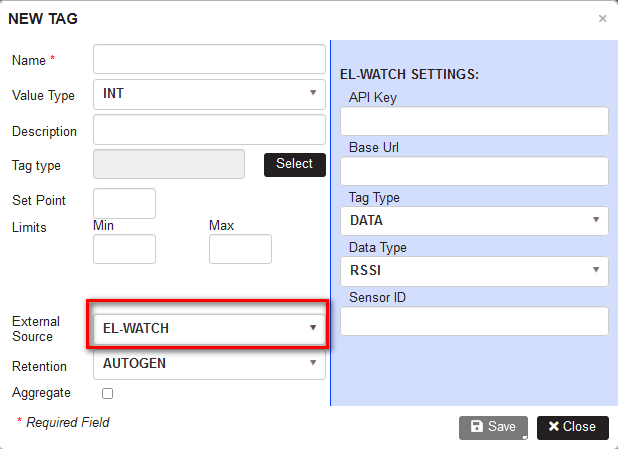
Figure 29: Add Tag - external sensor El-Watch configuration
After saving the tag with an external sensor in the column Source of the tags list is shown El-Watch.

Figure 30: Tag with El-Watch sensor
For more details go to El-Watch sensors configuration
Configuration of tag with Neuron sensor
Precondition: The New tag form is opened. Filled in the tag name and tag type.
Select from the External source dropdown the type of the external sensor – Neuron Sensors.
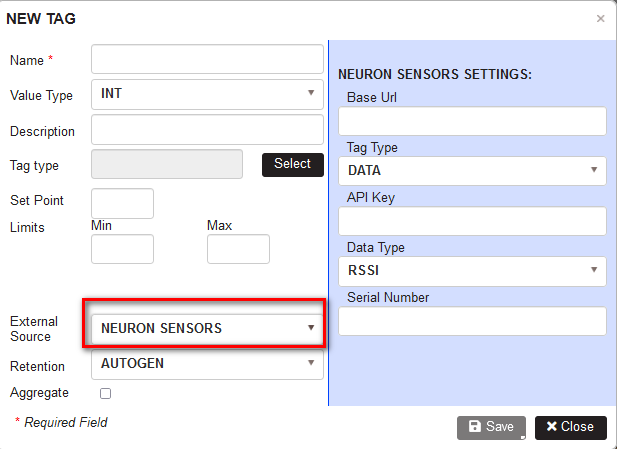
Figure 31: Add Tag - external sensor Neuron sensors configuration
Fill in the fields Base URL, API Key, Data Type, Serial Number.
After saving the tag with an external sensor in the column Source of the tags list is shown Neuron Sensors.

Figure 32: Tag with Neuron sensors
For more details go to Neuron sensors configuration
Configuration of tag with NCD sensor
Precondition: The New tag form is opened. Filled in the tag name and tag type.
Select from the External source dropdown the type of the external sensor – NCD Sensors.
NCD sensors have two tag types – PPMS and PMS.
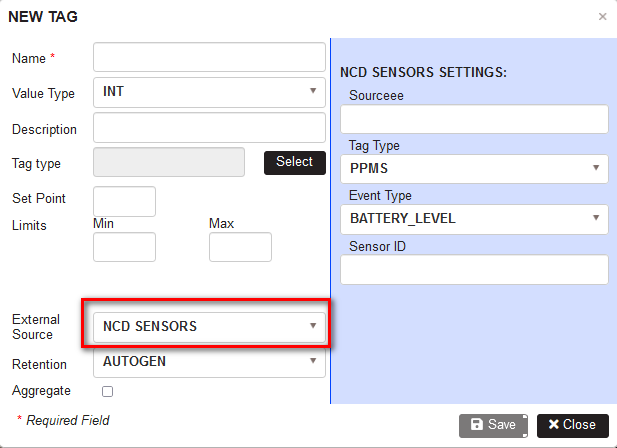
Figure 33: Add Tag - external sensor NCD sensors configuration
Fill in the fields Source, Sensor ID, select Event type.
After saving the tag with an external sensor in the column Source of the tags list is shown NCD Sensors.
For more details go to NCD sensors configuration
Configuration of tag with Weather sensor
Precondition: The New tag form is opened. Filled in the tag name and tag type.
Select from the External source dropdown the type of the external sensor – Weather.
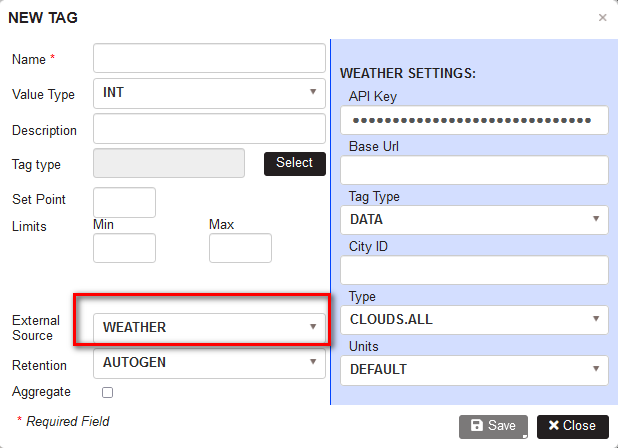
Figure 34: Add Tag - external sensor Weather configuration
Fill in the fields API Key, Base URL, City ID, Type, Units. Save the tag.
For more details go to Open weather map configuration
Import tags from file
Precondition: The machine is selected in the organization tree. Select tab Bulk Create.
Purpose: Add tags for the machine by importing from a file.
Tags for the machine could be imported from a CSV file. TAB is visible only for users with the role System administrator.
Upload a CSV file with description of each tag by name, valueType, (PayloadType), and (DisplayName).
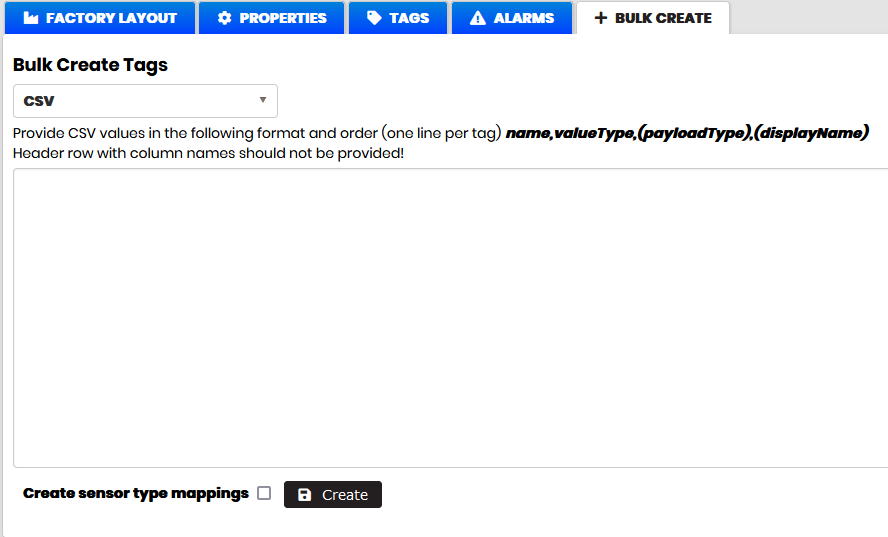
Figure 35: Machine - Import tags
Delete Tag
Precondition: The machine is selected in the organization tree. The TAGS tab is selected.
- The list of configured tags for the machine is opened.
Purpose: To delete the machine tag.
Select some machine tag and click Delete.
- The confirmation warning when the tag has not a data appears:
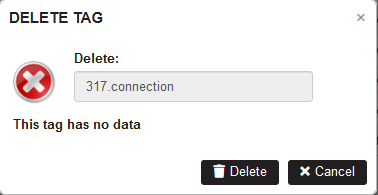
Figure 36: Tags - Delete tag without data confirmation
Confirm with Delete.
- The tag is deleted.
When a tag has data after clicking Delete appears warning:
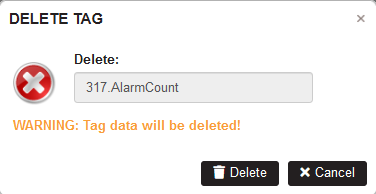
Figure 37: Tags - Delete tag with data confirmation
- After confirmation, the tag and their data are deleted.
When a events are created with the tag after clicking Delete appears warning:
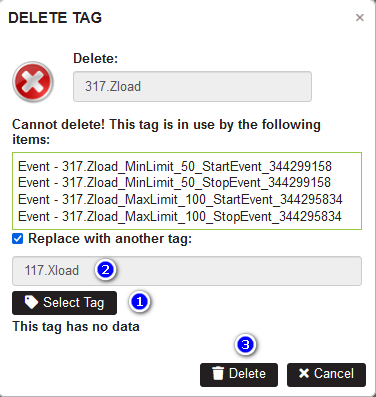
Figure 38: Tags - Delete tag with events confirmation
The user has to select another tag by clicking on the Select Tag button.
Click the Delete button.
- The tag is deleted from the machine tags list.
- The deleted tag is replaced in the events expressions with the selected new tag.
Preview and manage tags
Precondition: The machine is selected in the organization tree. Select tab TAGS. Click on the Preview Data button.

Figure 39: Tags list - Open Preview Data
- The Preview Data form is opened with interval Date From – Date To loaded by default one month back. Select Tags is All by default.
Purpose: The Preview Data form allows:
- View and filter tags for the selected time period.
- View tags data with last value, min, max, avg, and count for the selected time period.
- View if tags have events or calculated tags.
- View tags source (system, machine type, or external sensors).
- Some tags are possible to select and disable. They are hidden from the list.
- Disabled tags are possible to delete permanently.
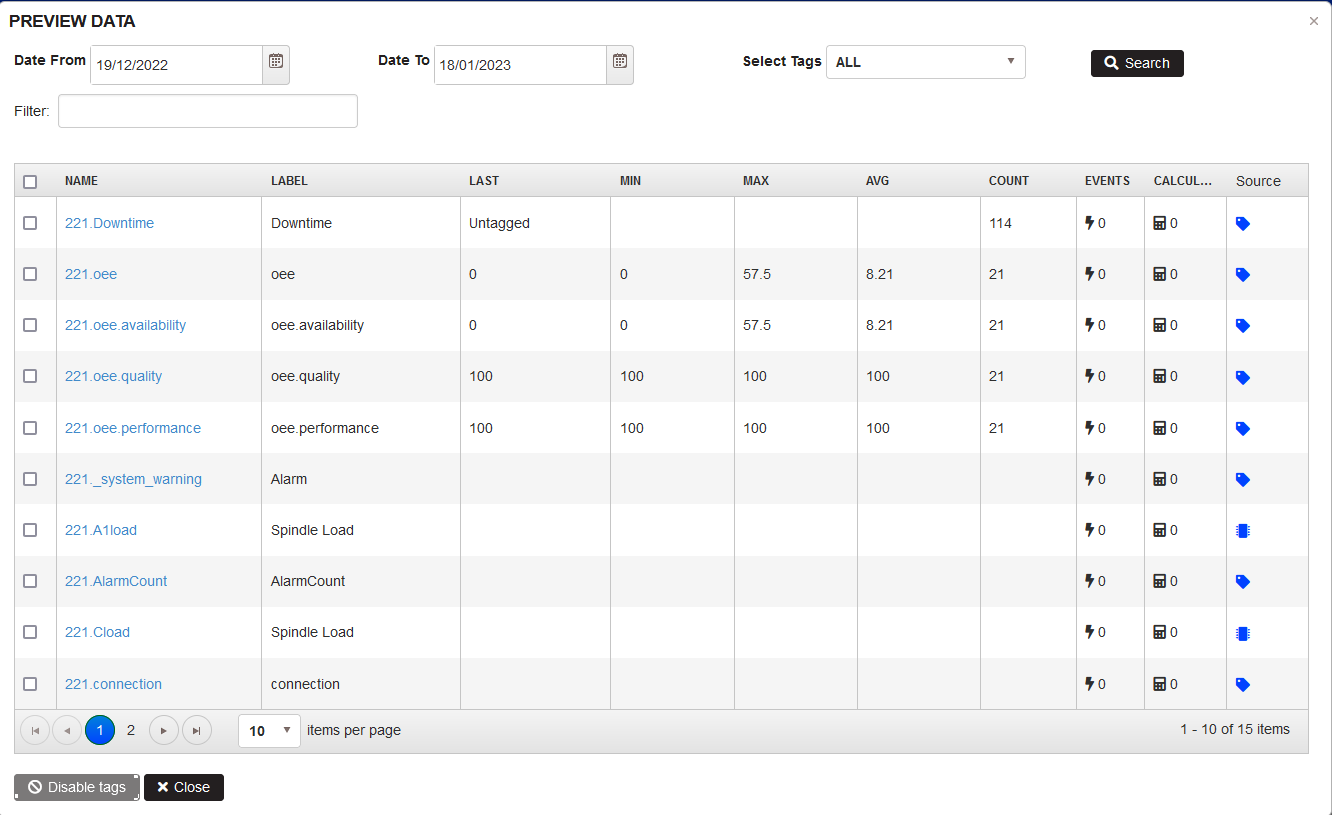
Figure 40: Preview data form
Tags in the table are shown in columns: Name, Label, Last, Min, Max, Avg, and Count (the last, minimum, maximum, average, and count of data for the selected time period). In the columns Events and Calculated tags are shown the numbers of events and calculated tags created with this tag. In the last column Source is visible the type of the tag source.
The source of the tag indicates the tag origin with a specific icon before the description:
- Machine type – the supported machine types are: Fanuc, Mazak, Heidenhain, Datron, Fanuc Robot, Deburring cell, UR Nakamura Cell, Robotic Cell.
- System - system tags are common tags for all machine types.
- External sensors - this appears for tags connected to external sensors. Supported types of external sensors are Disruptive technologies, ReMoni, Neuron sensors, El-Watch, NCD, Weather, etc. See Add Tag with external sensor
Table with tags is possible to sort by clicking on each column title.
Filtering machine tags is possible by entering the text in the Filter field:
- The table with tags is automatically filtered
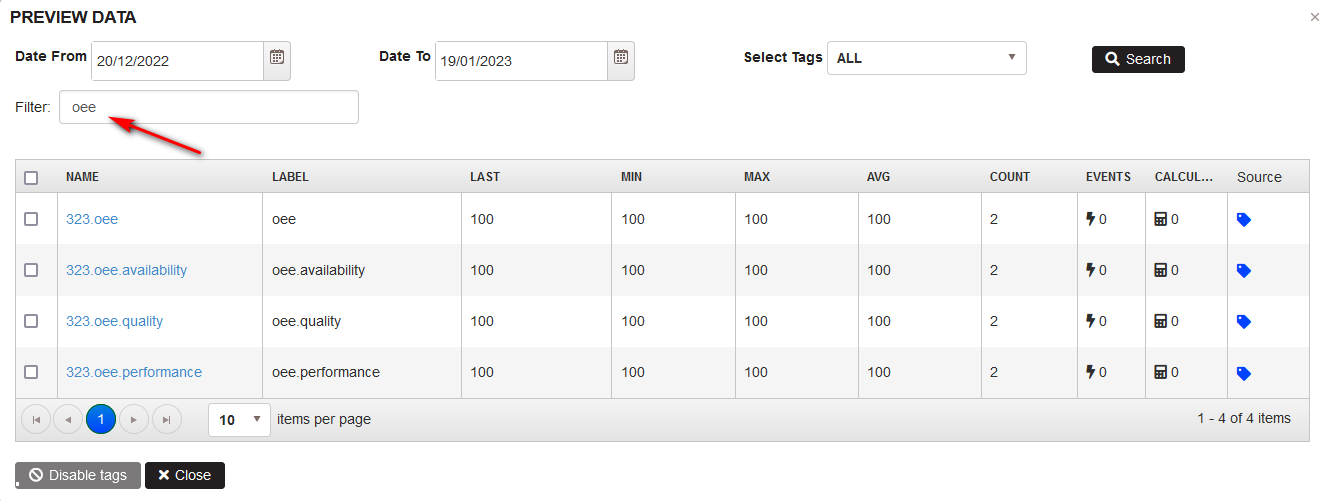
Figure 41: Preview data - filter by text
Filtering machine tags is possible by period.
Change the Date From – Date To. From the filter Select Tags is possible to select: All, Empty tags, Tags with data, or Disabled tags. Click the Search button.
- The table with tags is filtered according to the selected options.
Filtering the tags is possible by the following options: All, Empty tags, Tags with data, Disabled tags.
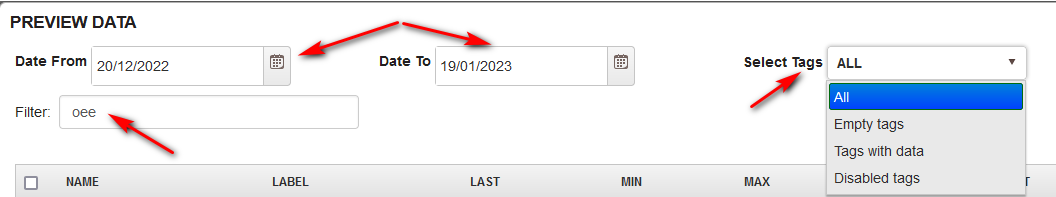
Figure 42: Preview Data - filtering tags
Select option Tags with data and click Search.
- The table shows only tags with data for the selected period.
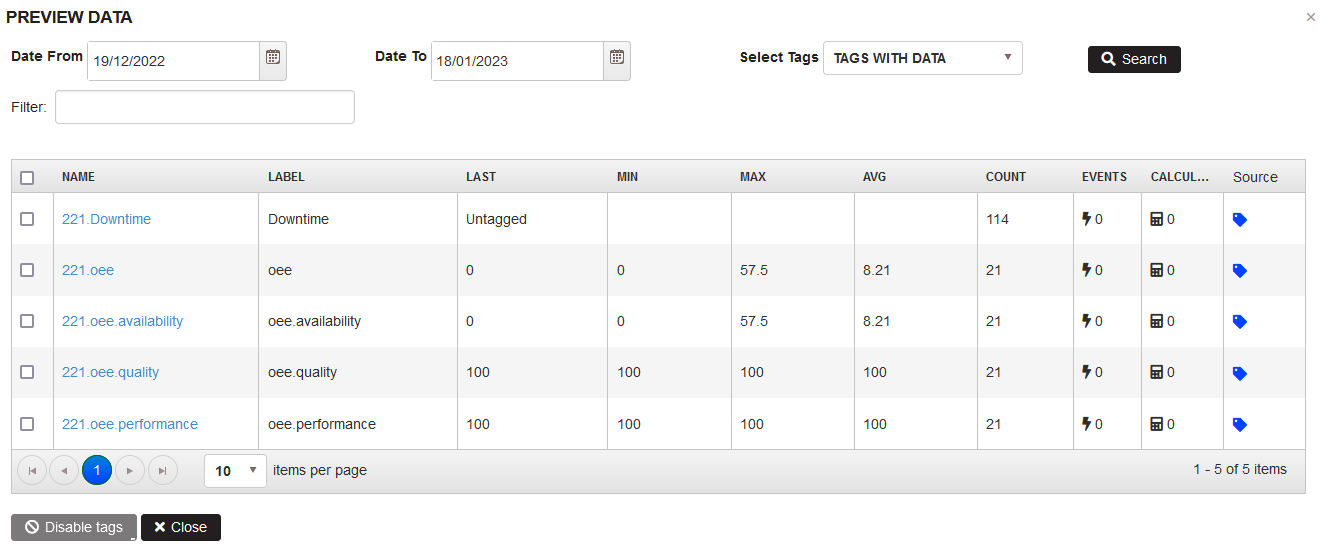
Figure 43: Preview data - tags with data for the selected period
Select option Empty tags and click Search.
- The table shows only tags without data for the selected period.
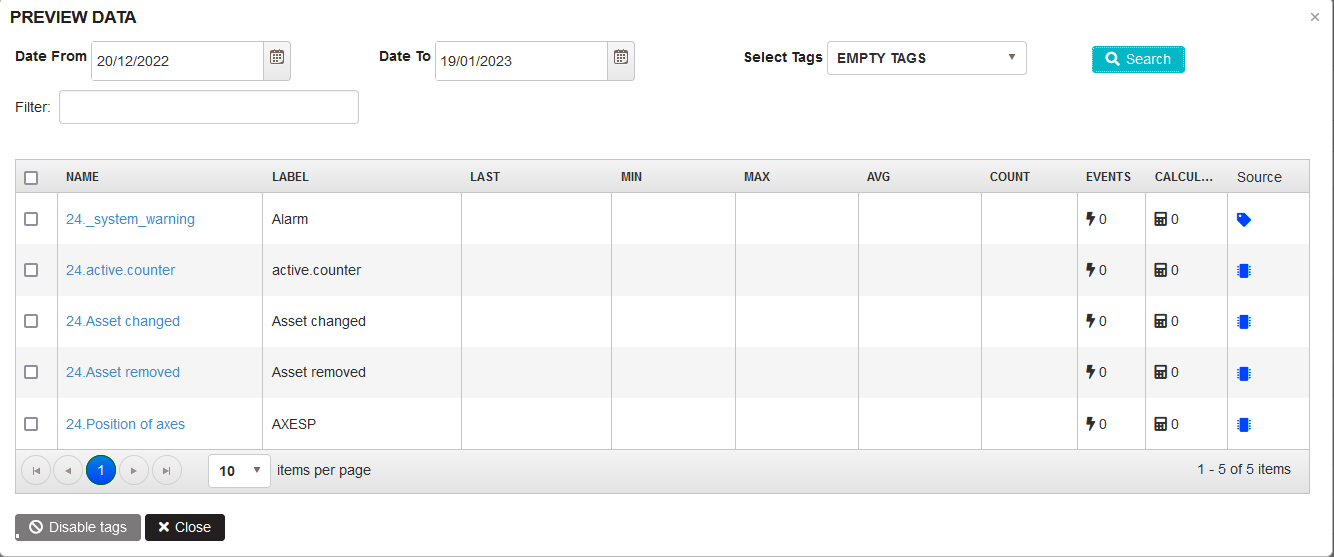
Figure 44: Tags - Preview Data – tags without data for the selected period
Some tags are possible to select by checkboxes and disable by clicking Disable tags button.
- Disable confirmation form is opened. Click the Disable button.
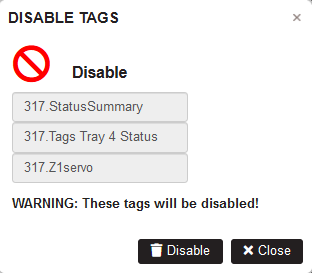
Figure 45: Preview Tags - Disable tags confirmation
- Disabled tags are hidden from the table.
Select the option Disabled tags and click Search.
- The table shows only disabled tags for the selected period.
Only disabled tags are possible to delete.
To Delete tags:
- Filter disabled tags.
- Select tags without data for deleting.
- Click the Delete tags button.
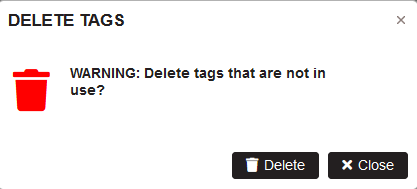
Figure 46: Preview Tags - Delete tag without data confirmation
Click Delete to confirm
- The tags are deleted from the machine
Select a tag with data and disable. Filter disabled tags and click Delete tags.
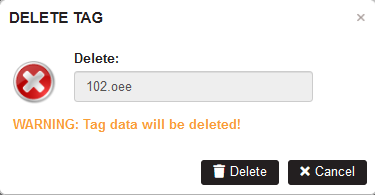
Figure 47: Preview Tags - Delete tag with data confirmation
Click Delete to confirm.
- The tag with data will be deleted.
Select to delete a tag that has events or calculated tags created with it.
Click Delete tags button.
- There is offered to replace the tag in events and calculated tags with another tag.
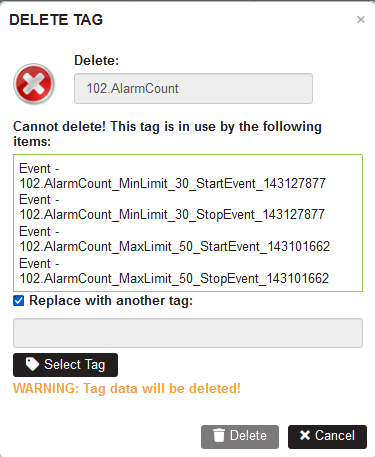
Figure 48: Preview Data - select tag to replace and delete tag
Click the Select Tag button and select another tag.
Click Delete button.
- The deleted tag in events and calculated tags are replaced with the selected new tag.
- The tag is deleted from the machine.
Write tags to gateway
Precondition:
- The gateway (Windows or Linux) is created in the IoT Hub as Device or IoT Edge device.
- The machine has been added to the organization tree.
- The machine is updated with filled Data Communication settings.
- The machine configuration has been added to the corresponding gateway module.
- The machine tags have been added.
- The machine tags have Source named with the template name from the machine properties.
Purpose: All machine's type-specific tags are possible to write to the gateway.
Select the machine in the organization tree. The machine has a template type for example Sinumerik 840D
The machine is configured with communication type RPC SINUMERIC(WINDOWS) and a gateway.
The machine is updated with Communication settings for the selected communication type.
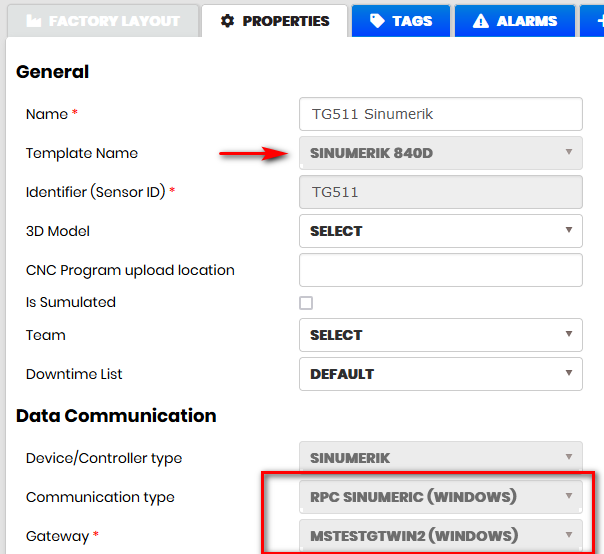
Figure 49: Machine - Properties
In the gateway module, RPC-Sinumeric837 desired properties JSON configuration is added machine's configuration.
Add tags to the machine following the steps in the Add Tag
Filter the machine-specific tags.
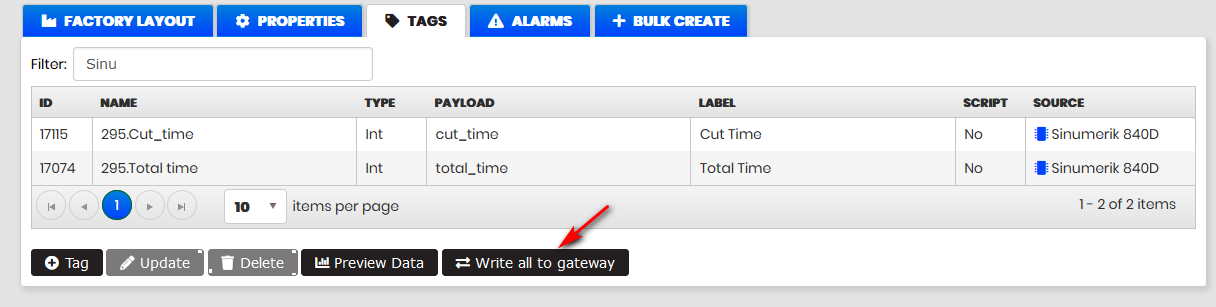
Figure 50: Machine - machine-specific tags
Click the button Write all to gateway.
- The machine-specific tags are written in the machine's gateway module desired properties.
Select the menu Gateways. Select the machine gateway from the list. Click the tab Modules.
Select the module corresponding to the machine communication type.
Click the Edit button.
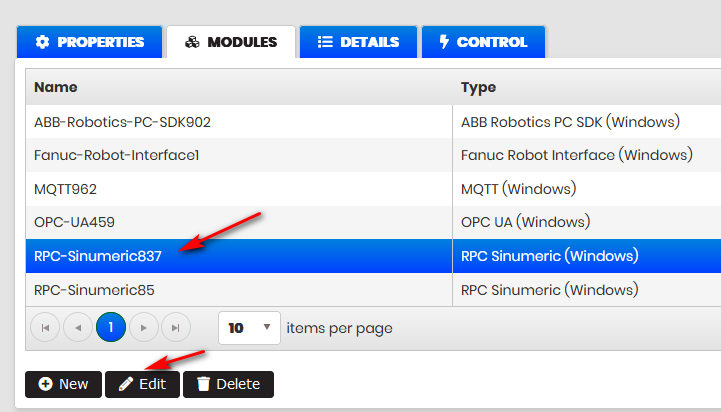
Figure 51: The gateway module with machine communication settings
- To the machine configuration is added the following section with the machine-specific tags.
  "DataItemsToMonitor": {
    "TG511": "cut_time,total_time"
  },
Tags Browser
Purpose: The Tags browser functionality is developed for specific adapters. From the machine tags' list clicking the Browse Device button is opened a form with a loaded tree with tags from the adapter server. Users can select some tags, view or change the tag name, type, payload, or display name, and click the Save button.
- The selected tag(s) are added to the machine tags list
- The Tags types list is updated
- Imported tags are added to the adapter’s desired properties to monitor data from imported tags.
Note: To use the functionality machine configuration has to be added in the gateway adapter module Desired Properties JSON configuration. То adapters configuration.
Select the machine in the organization tree and click TAGS. Click the button Browse Device.
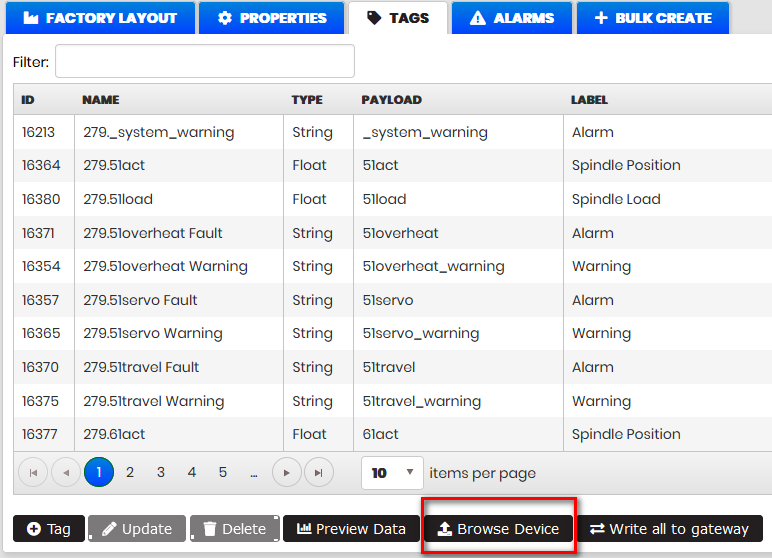
Figure 52: Machine - tags
- There is opened a form for browsing and importing tags from the adapter server.
OPC UA Tags Browser
Precondition: The machine has to be configured with the correct data communication settings.
- Select the machine in the organization tree. Select the tab Properties.
- Select in Data communication: Device/Controller type, Communication type: OPC UA(LINUX) or OPC UA(WINDOWS), Gateway(Linux) or Gateway(Windows).
- Fill in the Data Communication Settings.
- Click the Update button.
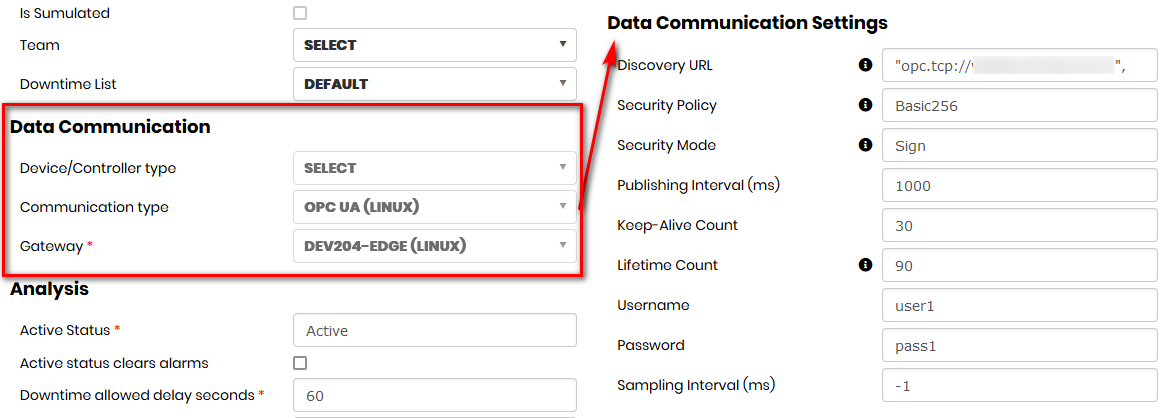
Figure 53: Machine with OPC UA communication type
- The machine configuration is added in the gateway module desired properties.
Example of configuration for machine with OPC UA(LINUX) communication type.
"ws350": {
	"DiscoveryUrl": "opc.tcp://ws206.icb.bg:51212",
	"SessionChannelTimeout": 30000,
	"PublishingInterval": 60000,
	"KeepAliveCount": 30,
	"LifetimeCount": 30,
	"PublishingEnabled": true,
	"UserName": "",
	"Password": "",
	"SamplingInterval": -1,
	"QueueSize": 0,
	"DiscardOldest": true,
	"QualityControl": {
		 "Characteristics": "2:Robot1\_Axis1",
		 "SerialNumber": "2:Robot1\_Axis2",
		 "Order": "2:Robot1\_Mode",
		 "Operation": "2:Robot1\_Speed",
		 "OrdPosCombined": false,
		 "OrdPosSeparator": "-",
		 "Event": "Always",
		 "HandshakeTag": "",
		 "Position": "2:Robot1\_Speed"
	}
}
Select the machine in the organization tree and click TAGS. Click the button Browse Device.
- The form Device Tags is opened with loaded tags from the device adapter.
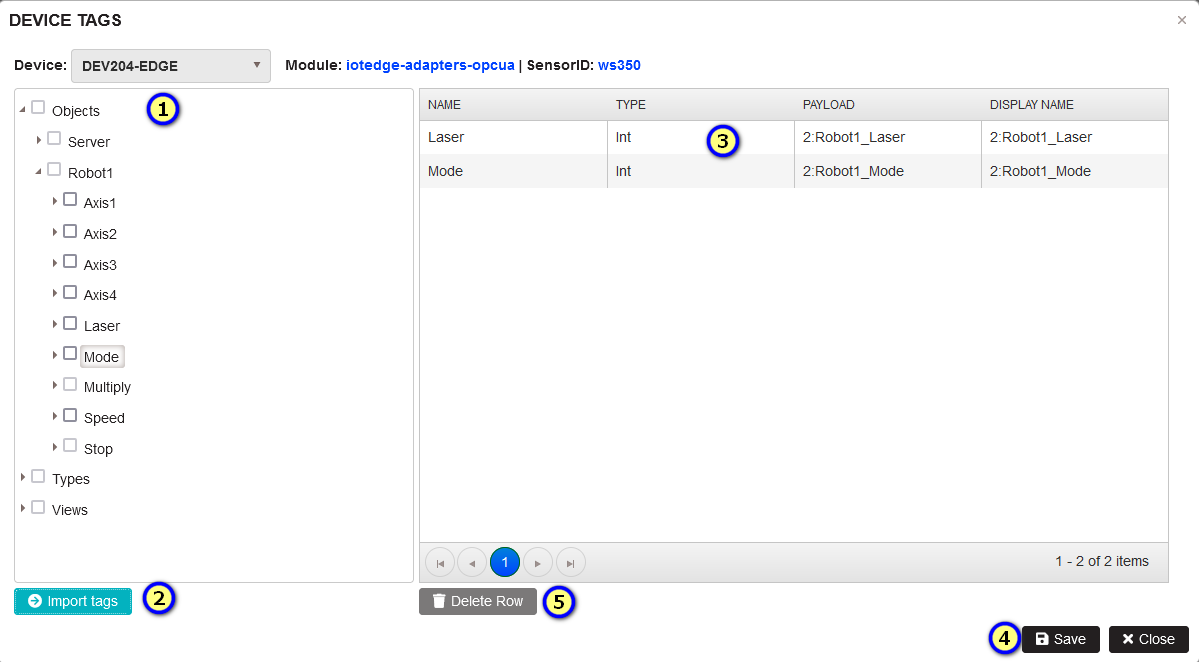
Figure 54: OPC UA Tags browser
At the top are visible device adapter (gateway), device module and machine ID.
- There is a loaded tags tree from the device adapter.
- User can select some tags and click the Import tags button.
- In the selected tags list user can change Name, Type, Payload, or Display name.
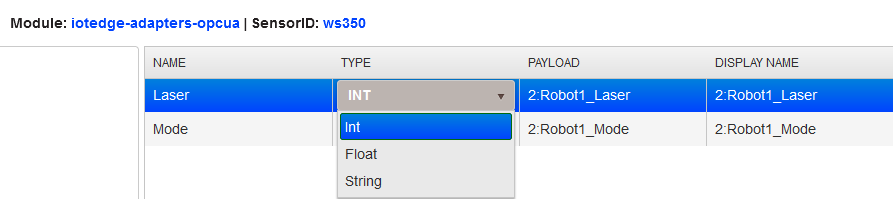
Figure 55: Tags browser - edit tags properties
- It is possible to delete some rows with selected tags by Delete Row button and importing tags again.
- Click Save.
After successful saving appears Create Tags message.
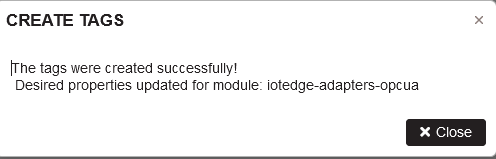
Figure 56: Tags browser - create tags successfully
If trying to duplicate some tag by name or payload appears Duplicates found message.
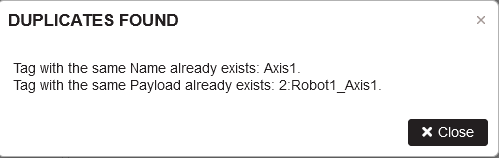
Figure 57: Tags browser - duplicates found
After successful import:
- The imported tags appear in the machine tags list
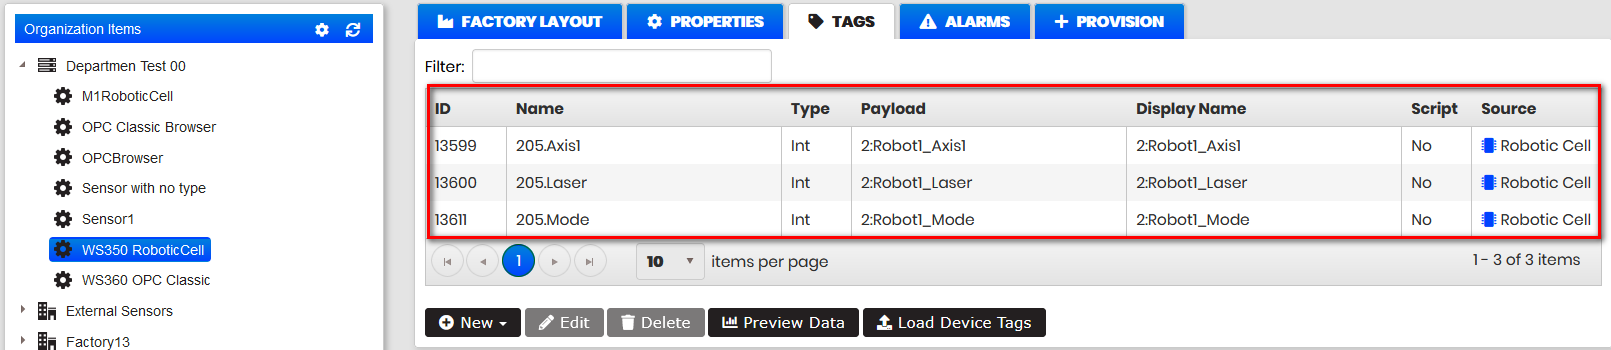
Figure 58: Machine tags list with imported tags
- The imported tags are added in the adapter module desired configuration properties section “dataItemsToMonitor”. If data are coming to imported tags they can be visualized in the Upkip Visualization application.
"dataItemsToMonitor": {
	"ws350": "2:Robot1\_Axis1,2:Robot1\_Axis4,2:Robot1\_Axis3"
}
OPC Classic Tags Browser
Precondition: The machine has to be configured with the correct data communication settings.
- Select the machine in the organization tree. Select the tab Properties.
- Select in Data communication: Device/Controller type, Communication type: OPC CLASSIC(LINUX) or OPC CLASSIC(WINDOWS), Gateway(Linux) or Gateway(Windows).
- Fill in the Data Communication Settings.
- Click the Update button.
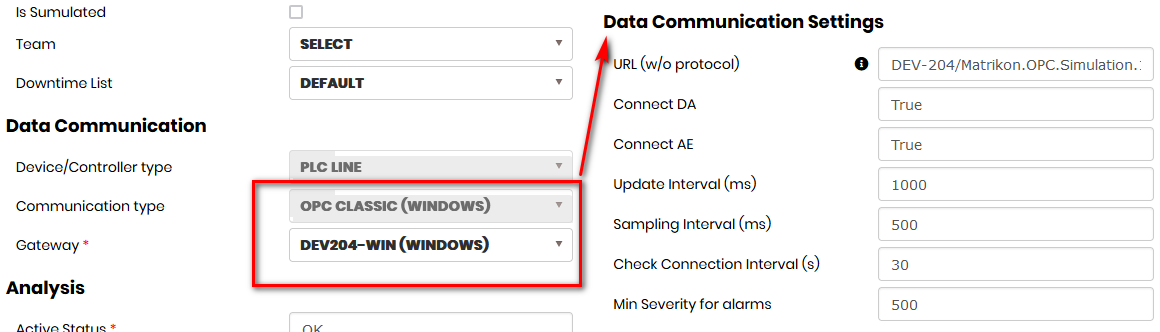
Figure 59: Machine with OPC Classic communication type
- The machine configuration is added in the gateway module desired properties.
Example of configuration for machine with OPC CLASSIC(WINDOWS) communication type.
"opc_cl": {
      "UrlNoProtocol": "DEV-204/Matrikon.OPC.Simulation.1/{f8582c...}",
      "ConnectDaClient": true,
      "ConnectAeClient": true,
      "UpdateRate": 1000,
      "SamplingRate": 500,
      "SamplingRateSpecified": true,
      "EnableBufferingSpecified": false,
      "MaxAgeSpecified": false,
      "DeadbandSpecified": false,
      "CheckConnectionIntervalSeconds": 30,
      "OverrideServerTime": true,
      "ConvertServerTimeToUtc": true,
      "IgnoreTimestampSpecified": true,
      "AlarmMinSeverity": 500,
      "AlarmsAndEventsFilters": null,
      "ParseByteArrayAsText": true,
      "SendEmptyStrings": true,
      "EmptyTagsToFix": null,
      "EmptyTagsToFixValue": "-",
      "SendFalseBooleans": false,
	  ...
	}
Select the machine in the organization tree and click TAGS. Click button Browse Device
- The form Device Tags is opened with loaded tags from the device adapter.
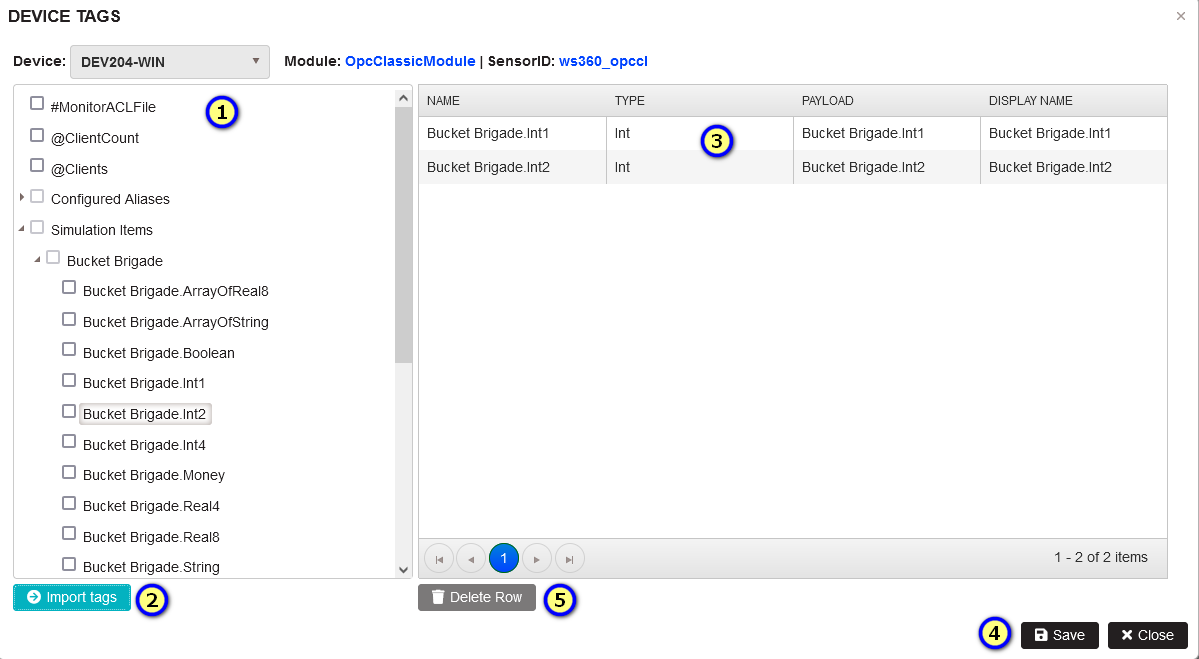
Figure 60: OPC Classic Tags browser
The user can select tags from the adapter server tags tree and import them to the machine tags list.
- The imported tags are added in the adapter module desired configuration in section “SensorDataItemsToMonitor”. If data are coming to imported tags they can be visualized in the Upkip Visualization application.
"SensorDataItemsToMonitor": {
	"opc_cl": "Random.Int1,Random.Int4,Random.UInt2,Random.Int2",
	"ws360_opccl": "Random.Int1,Random.Int2"
}
MTConnect Tags Browser
Precondition: The machine has to be configured with the correct data communication settings.
- Select the machine in the organization tree. Select the tab Properties.
- Select in Data communication: Device/Controller type, Communication type: MTConnect(LINUX) or MTConnect(WINDOWS), Gateway(Linux) or Gateway(Windows).
- Fill in the Data Communication Settings.
- Click the Update button.
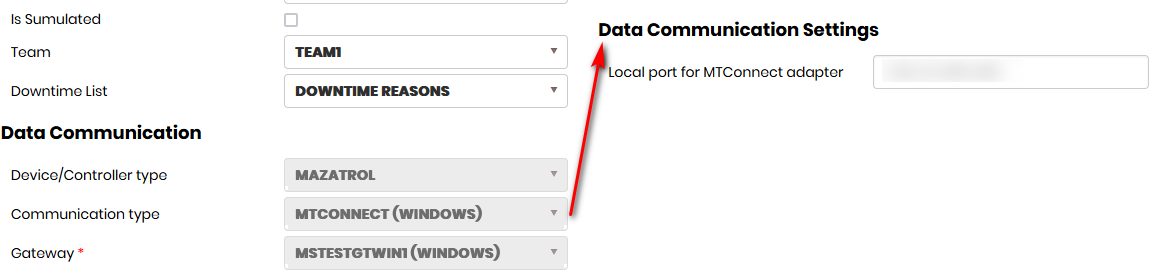
Figure 61: Machine with MTConnect communication type
- The machine configuration is added in the gateway module desired properties.
Example of configuration for machine with MTConnect(WINDOWS) communication type.
In the MTConnect Agent is configured:
{
    "Adapters": {
      "TG601": {
      "Host": "127.0.0.1",
      "Port": "120.....",
      "AutoAvailable": "false"
	  }
	  ....
   }...
  },
Select the machine in the organization tree and click TAGS. Click the button Browse Device
- The form Device Tags is opened with loaded tags from the device adapter.
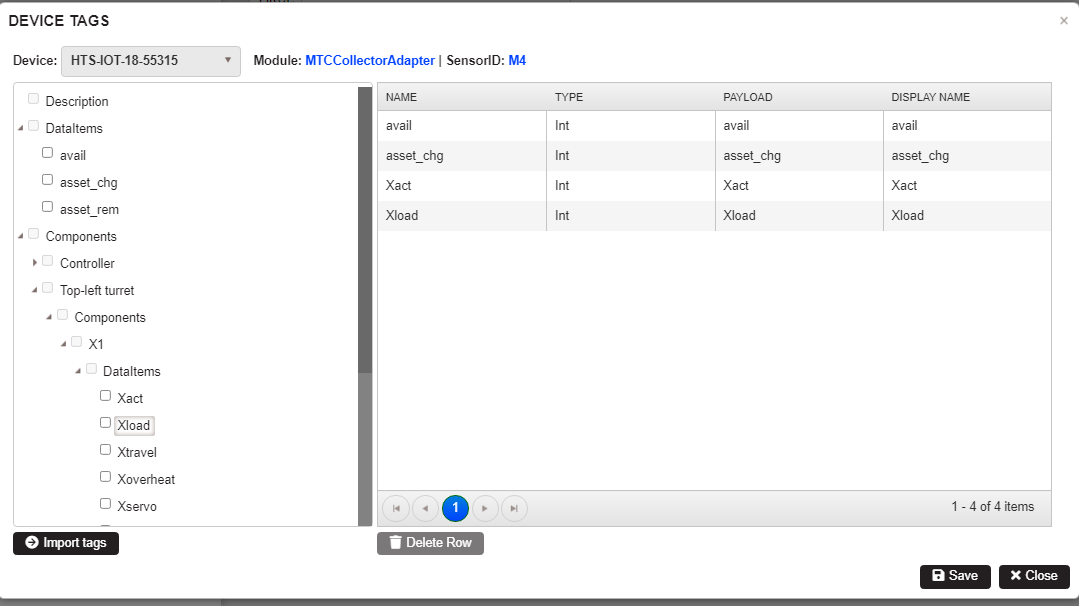
Figure 62: MTConnect Tags browser
The user can select tags from the adapter server tags tree and import them to the machine tags list.
- The imported tags are added in the adapter module desired configuration in section “SensorDataItemsToMonitor”. If data are coming to imported tags they can be visualized in the Upkip Visualization application.
In the MTConnect-Collector are added tags to monitor:
{
  "DataItemsToMonitor": {
    "TG504": "A1load,TG60X,total_time,Xload",
    "TG600": "cut_time,TG60X",
    "TG601": "Sload,TG60X",
  },
}
Machine Alarms
Precondition: The machine is configured in the organization tree.
Select the machine in the organization tree. Select tab Alarms.
- All machine alarms (tags with label Alarm) appears in the list.
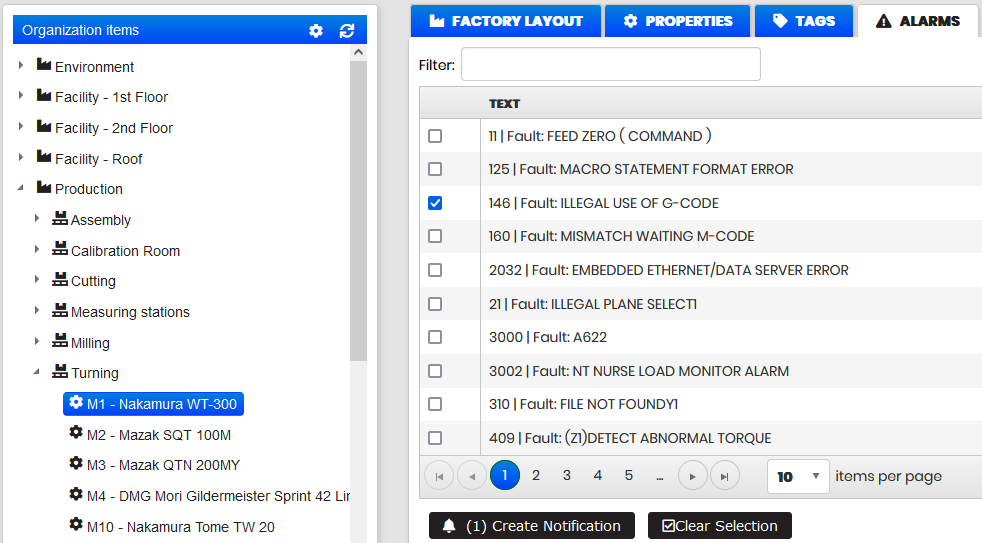
Figure 63: Machine alarms
Each alarm has a Severity. The available severity types are Critical, Alarm, Warning, and Info. To change the alarm severity click on the severity value, select from the dropdown another value and click the Save button.
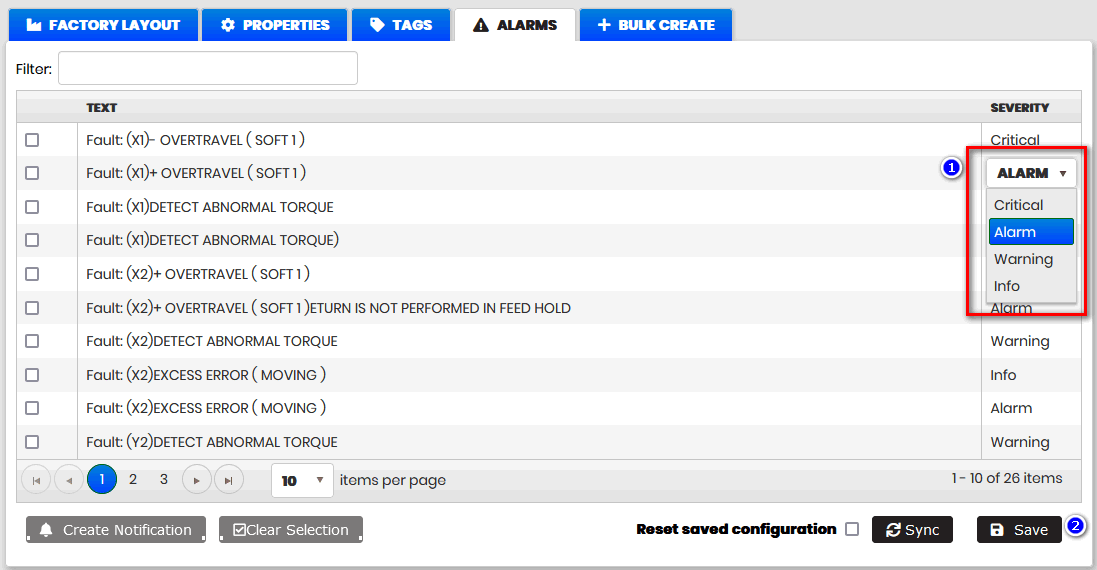
Figure 64: Machine alarms severity
- The alarm severity is changed
Selecting some alarm(s) is possible automatically to create an event, warning, and notification for the selected alarms.
Go to Notifications from machine alarms.
There is an indication with an icon on the first column if for some alarm is created notification.
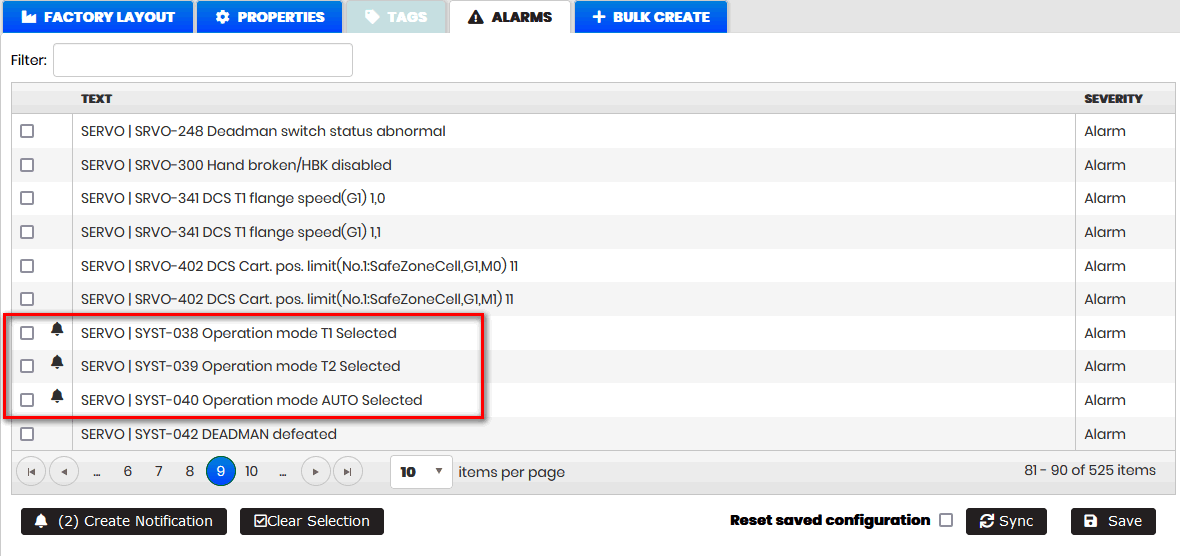
Figure 65: Machine alarm with notification
There is developed a Built-in function for checking alarm severity. The function can be used when creating expressions in events or calculated tags. Go to Add function in expression
AlarmSeverity(GetTagNameByTagType('Alarm')) = 'Alarm'
Go to Create new event
Factory Layout
Purpose: The Factory layout functionality in the Upkip Administration allows:
- Configure the factory layout floors for the organization.
- Add machines to the factory layout floors.
- Machine models can be moved, resized, and arranged on the factory floors.
- Created layout design with machines is shown in the Upkip Visualization application.
In the section are described:
- Configure factory layout
- Machines
- Factory Layout
- Expand and collapse the main menu
- Visualize factory layout
Configure factory layout
Precondition: The user has logged in to the Upkip Administration. The Organization menu is selected.
The user clicks on the configuration icon on the top right of the organization tree:
- At the right is shown tab Configure.
Purpose: The form is used to define the main properties and upload the pictures for the factory floors.
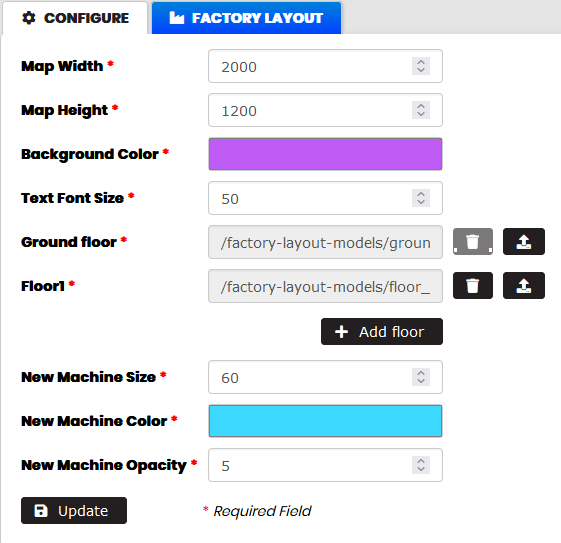
Figure 66: Organization - Configure factory layout and floors
In the Configure form is possible to define the:
- Map width and height – the size of the area where the factory layout will be designed.
- Background color, text font size, new machine size, color, and opacity.
- By Add Floor button user can add floors for the factory layout (up to three)
- For each floor is possible to upload pictures on which to arrange the machines.
To upload pictures for the factory floors:
- Click the Add Floor button.
- The row for uploading a picture of the floor is added.
- Click the Upload button, select some picture from the local storage and upload.
- The floor picture is uploaded in the Azure blob storage.
- The user can remove uploaded picture by Delete button.
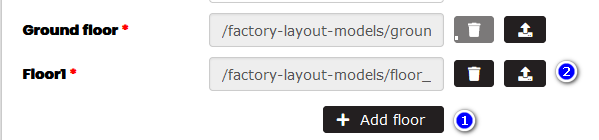
Figure 67: Configure factory floors
Add machine to factory floor
Precondition: The machine is added to the organization tree.
Purpose: The selected machine can be added to some of the defined floors of the enterprise.
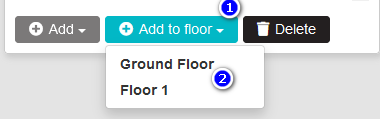
Figure 68: Add machine to factory floor menu
Select the machine in the organization tree. Click the button Add to floor and select from the menu one of the configured floors.
- The machine is added to the selected floor.
- The machine appears at the center of the selected factory floor.
- The machine data form appears on the right side.
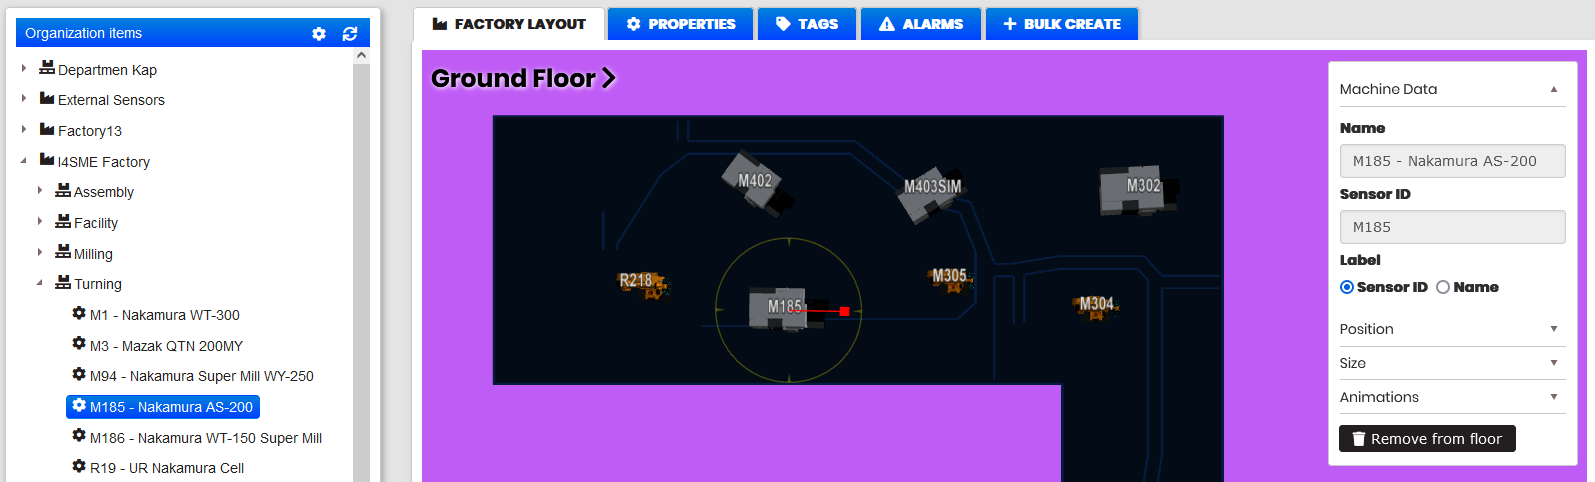
Figure 69: Organization - Add machine to floor
Connect animation with machine statuses
When the machine is added to the floor and selected, the right appears Machine Data. Machine models are possible to develop with some animation.
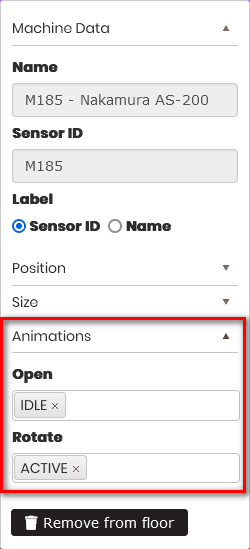
Figure 70: Selected machine on the floor – Animations
In the section Animations is possible to select machine statuses to connect them with the animation. This means when the machine has the configured statuses on the Factory Layout the machine animation will be played.
Select a machine
Purpose: Select a machine in the organization tree or on the factory layout
Select a machine in the organization tree. Select the Factory Layout tab.
- If the machine has been added to some floor the Factory Layout tab is opened with a centered machine model.
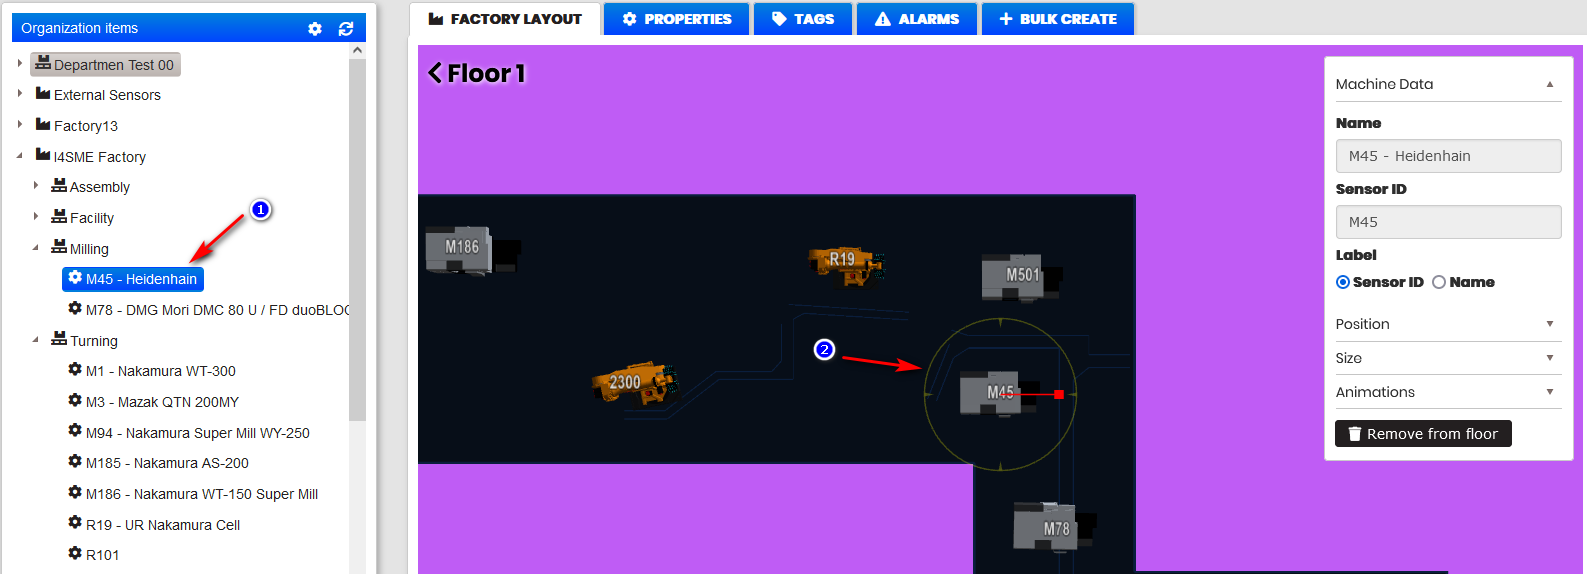
Figure 71: Selected machine on the tree - visualized on the factory layout
- If the machine has not added to the Factory Layout at the bottom of the organization tree appears button Add to floor.
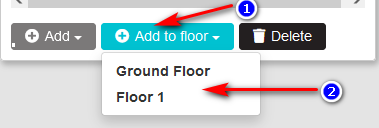
Figure 72: Organization tree - Add to floor button
Clicking on the button Add to floor and selecting floor from the menu, the machine is added to the factory layout floor.
In reverse when selecting some machine in the factory layout floor, the machine appears selected in the organization tree.
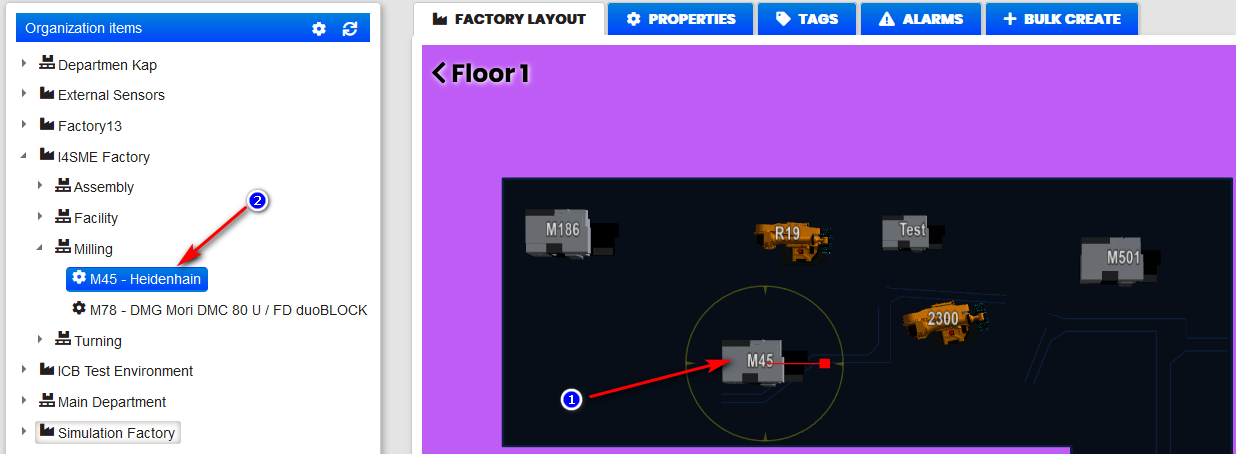
Figure 73: Select machine on the floor - show machine selected in the organization tree
Deselect a machine
Precondition: Machine is selected on the factory layout.
- Machine appears selected also in the organization tree
Deselecting the machine on the factory layout is possible by clicking again on the selected machine.
- The machine selection in the organization tree is removed.
- The organization tree is not collapsed.
- At the main area are visible tabs: Configure and Factory Layout.
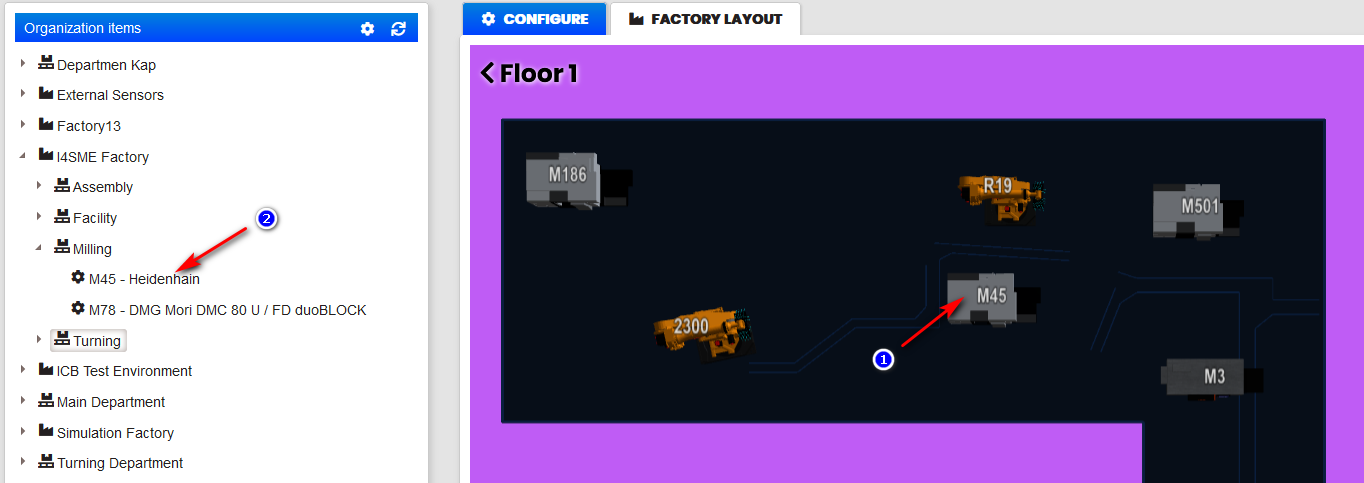
Figure 74: Deselected machine on the factory layout and organization tree
Deselecting the machine is also possible also by clicking the Refresh button at the top right of the organization tree.
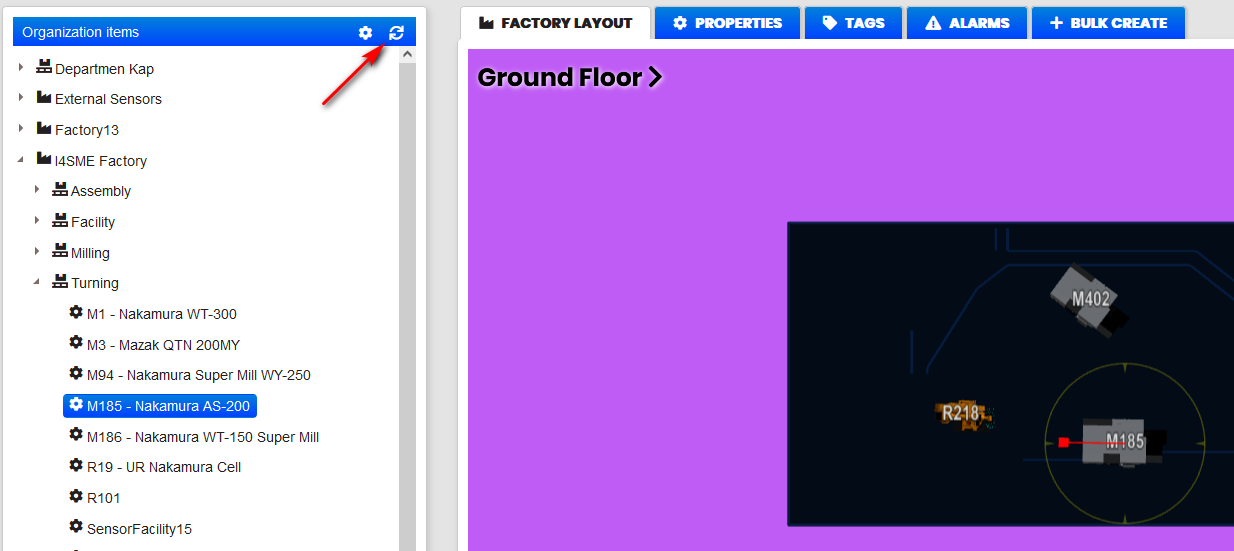
Figure 75: Organization tree and layout - deselect machine by refresh
After clicking the Refresh button:
- Machine selection in the organization tree is removed and organization tree is collapsed.
- At the main area are visible tabs: Configure and Factory Layout.
Change a machine location
Precondition: Click on the machine on the floor layout.
- The machine is selected with a circle around it.
Clicking on the machine without releasing the mouse is possible to move the machine to another location on the floor area.
On the Machine Data form the X and Y positions are changed.
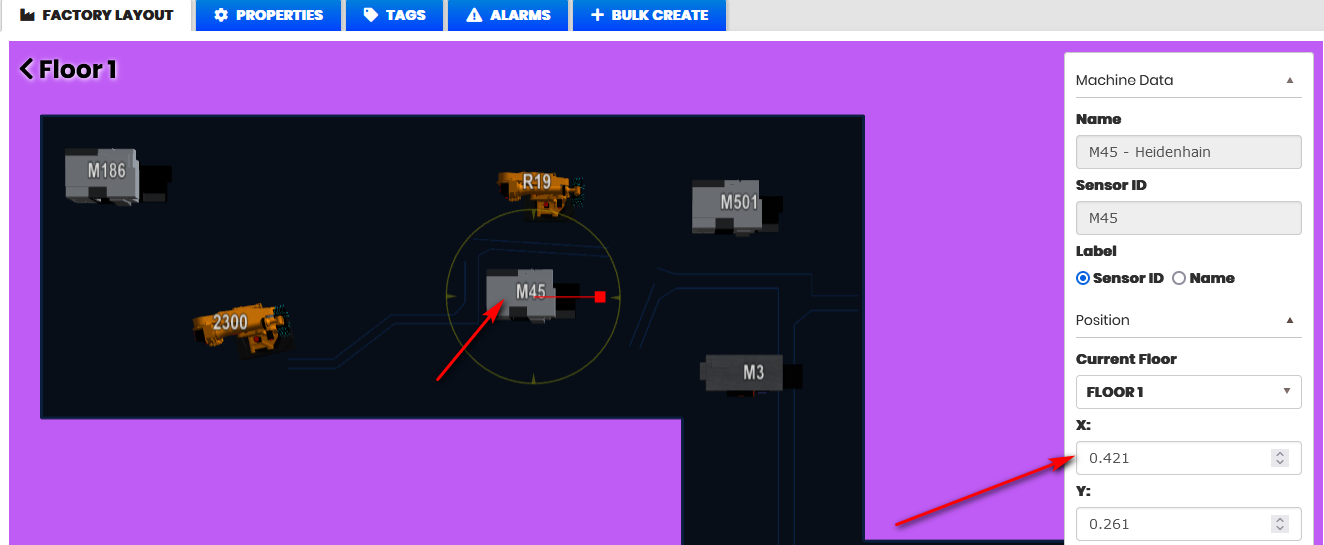
Figure 76: Factory floor - move the machine on the floor
Click the Save button.
- The factory floor is saved with the last machine location.
Resize and rotate a machine
Precondition: Click on the machine on the factory layout.
- The machine is selected with a circle around it.
Machine models can be resized and rotated.
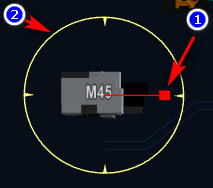
Figure 77: Machine model - resize or rotate
By clicking on (1) the machine can be resized, by clicking on the (2) machine can be rotated on the map.
When the machines are located on their places on the floor layout click the button Save to save the created layout with the machines locations.
Change the machine floor
Precondition: Click on the machine on the factory layout.
- The machine is selected with a circle around it.
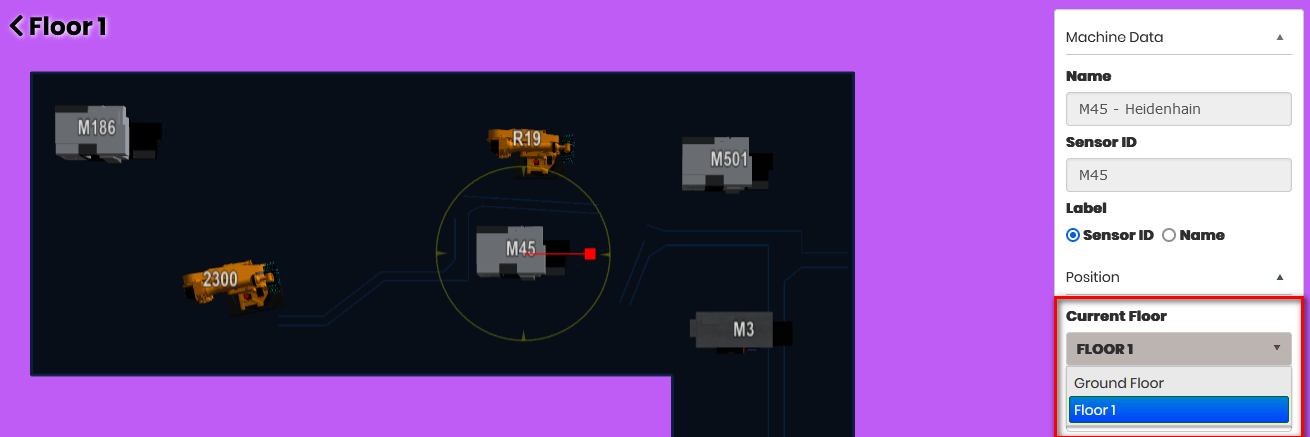
Figure 78: Factory Design layout – change the machine floor
From Machine Data change the current floor from the dropdown.
- The machine is moved to the selected floor.
- The new floor is opened with the machine focused in the center of the floor.
- Arrange the machine location and save the layout.
View floors of the factory layout
Precondition: The Factory layout is opened.
There is possible to switch between floors by clicking on the arrow after/before the floor name.
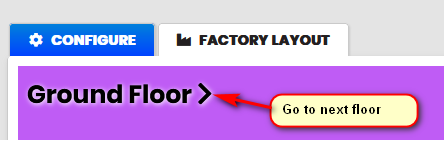
Figure 79: Factory layout - go to next floor
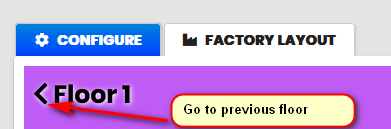
Figure 80: Factory layout - go to previous floor
Zoom the factory floor
Precondition: The Factory floor is opened.
It is possible to Zoom in or Zoom out the floor area to see better the machines and their locations by using the mouse scroll wheel.
Save the floor layout
Precondition: Factory floors are designed with added machines.
Click on the Save button to save the layout of the floors.
Expand and collapse the main menu
There is possible to collapse and expand the main menu.
Collapsing the main menu increases the floor design area and shows all main menus only with icons.

Figure 81: Upkip Administration -collapsed menu and button to expand
Expanding the main menu shows all menus with icon and text.
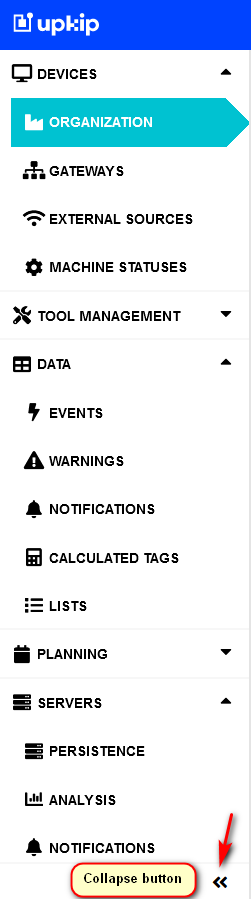
Figure 82: Upkip Administration -expanded menu and button to collapse
Visualize Factory Layout
Precondition: Factory floors with machines are configured in the Upkip Administration.
Log in to Upkip Visualization following the steps in Upkip Visualization Sign in
Selecting from the main menu Factory Layout opens the dashboard Factory Layout.
- Automatically are visualized on the factory layout configured floors with machines
- All functionalities of the factory layout have to work with added machines.
- If a machine has a status connected with an animation it is played.
Gateways
Purpose: Gateways are configured in Microsoft Azure IoT Hub as IoT Devices or IoT Edge devices and installed on the computers on the manufacturer's premises.
They act as a Cloud Gateway which:
- Connects to local hardware.
- Reads, transforms, and buffers data from various adapter modules.
- Interacts with the Azure Cloud infrastructure to send data and receive configurations.
- It is configured with the Recovery settings to restart 15 minutes after each failure.
Precondition: Log in to Upkip Administration with Microsoft AD user account.
Select under Devices the menu Gateways.
- The Gateways list opens.
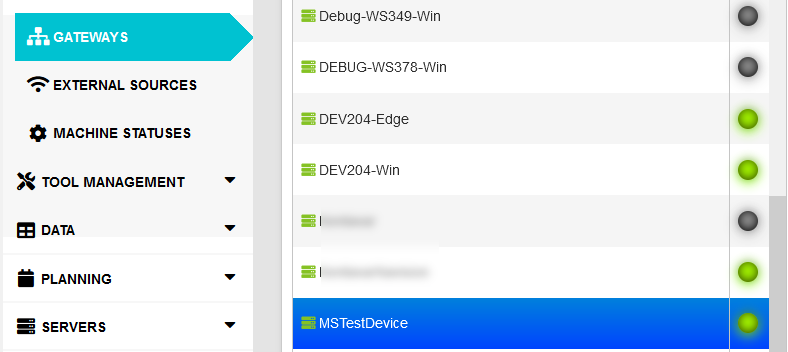
Figure 83: Upkip Gateways list
Click the Create button to add a new gateway.
- The New Gateway form opens.
Figure 84: Create new gateway
Fill in gateway details.
- Name (the gateway name in the Upkip gateway list).
- Device ID (the gateway name in the IoT Hub).
- Is Edge.
- If unchecked, a gateway will be created as an IoT Hub Device (running on Windows).
- If checked, a gateway will be created a gateway as an IoT Hub Edge device (running on Linux).
Click Add.
- The created gateway appears in the list.
- In the IoT Hub, an IoT Hub Device or IoT Edge device is created, depending on the "Is Edge" option.
Note! When you create a Linux gateway, additional custom gateway deployment must be done to make it usable. Ask the platform administrators for further information.
For example, in the Upkip Administration are used the following gateways (IoT devices or IoT Edge devices)
Used by the system internally:
- Calculated Tags (DeviceId: CalculatedTagAnalyser)
- ExternalTelemetry (DeviceID: ExternalTelemetryProcessor)
- Warnings (DeviceID: EventProcessor)
- Health Check (DeviceID: HealthCheckTestSensor)
- Synchronizer (DeviceID: RefreshTimer)
Software gateways installed on premises:
- Windows gateways
- Linux gateways
Select a gateway from the list.
- The Properties tab opens on the right side.
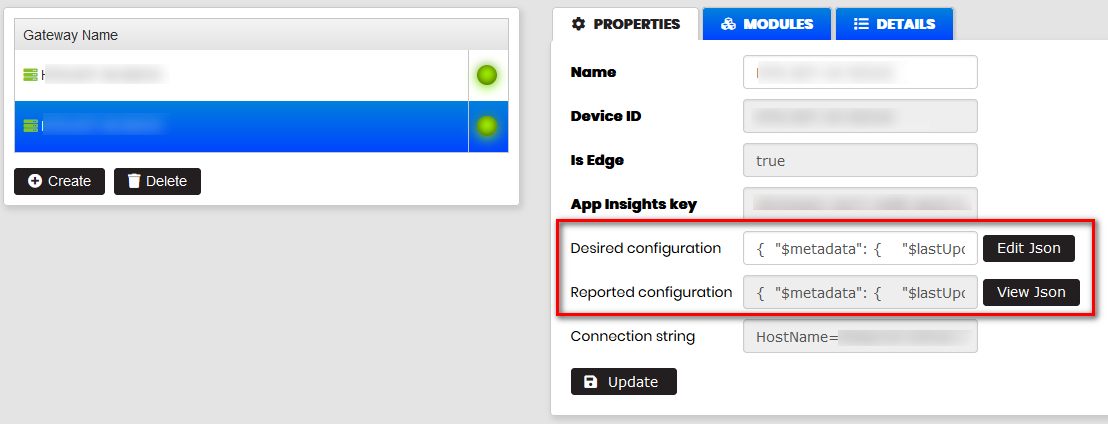
Figure 85: Gateway properties
Gateway Properties shows: Name, Device ID, Is Edge, Desired and Reported configurations.
By clicking the Edit Json button it is possible to edit the gateway configuration written as a JSON data. The Reported configuration is returned by the Azure and is usually equal to the Desired configuration.
Click on the tab Modules.
- The list of created modules in the gateway is displayed.
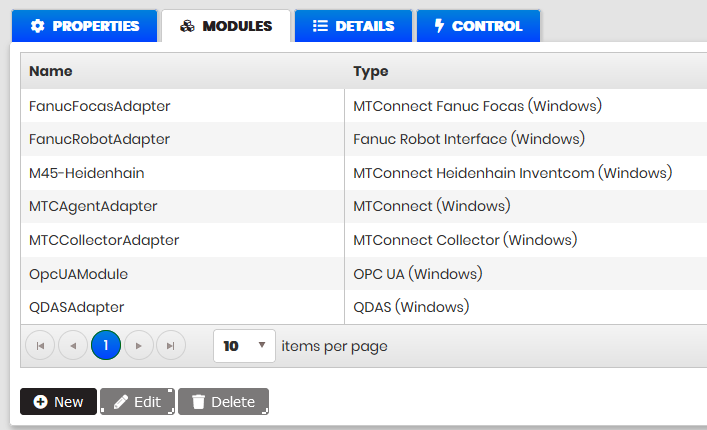
Figure 86: Gateway modules as IoT Hub devices
A module is created or updated when machine configuration settings are set or updated.
The modules run on the configured Devices in the IoT Hub.
When selecting some Linux Gateway name and then Modules are listed the modules:
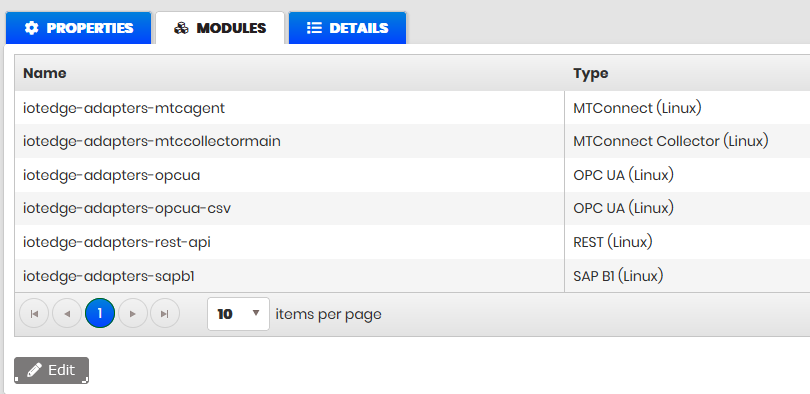
Figure 87: Gateway modules as IoT Edge devices
The modules run on the configured IoT Edge devices in the IoT Hub.
External Sources
Purpose: Menu External sources allows to define new type of external sources (sensors) and properties to connect and fetch the data from the source. Data from the source can be received in two ways:
- Executing one or two API requests to extract the source data.
- Receiving data from the external source.
Received input data are transformed by liquid JSON transformation template to Upkip internal data format.
Machine tags are connected to the selected external source and external data type with filled properties to fetch data from the source.
Configure tag with external sensor
Precondition: Log in to Upkip Administration as a user with the role System administrator or Organization administrator.
Expand the menu Devices and select menu External Sources.
- There is opened form to define a new external source (sensor)
- The new source is defined by name and label
- The necessary properties to connect to the source are possible to add
- For each source is possible to define data types
- To fetch data of specified data type is possible to add different properties
- The API Endpoint definitions are possible to specify
- Liquid template for JSON transformation is possible to specify to convert source data to the Upkip internal data format https://shopify.github.io/liquid/
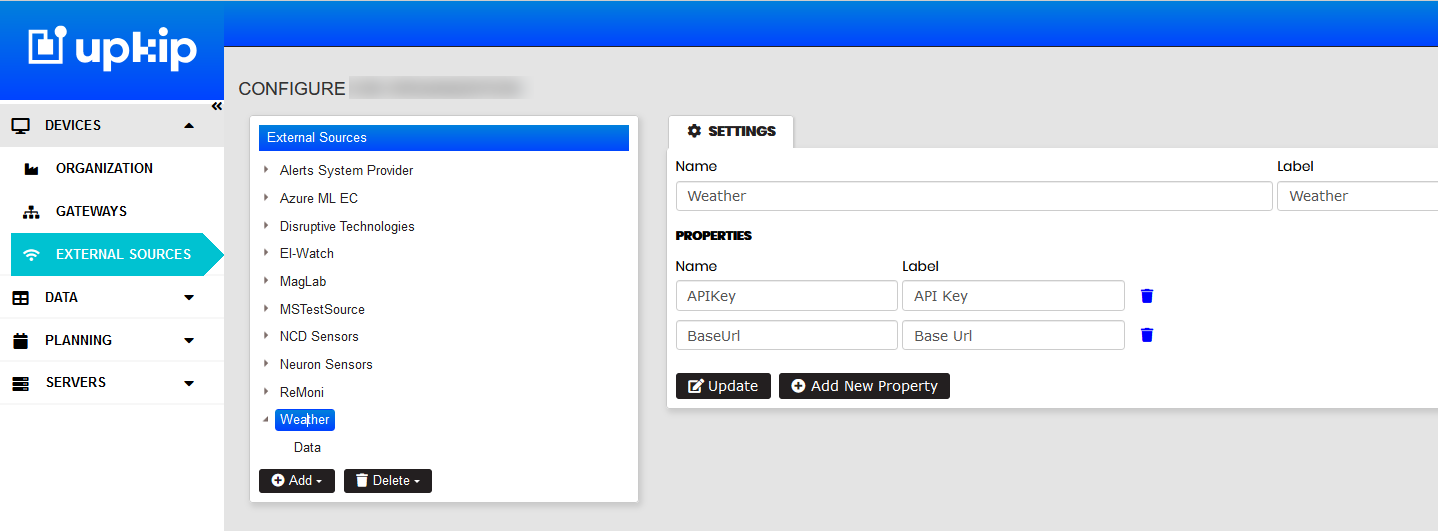
Figure 88: Upkip Administration - External sources
Add external source and tag type
The sources and their data types are configured in a tree view structure.
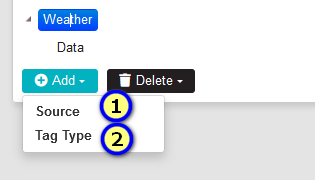
Figure 89: External sources - add new Source or Tag type
By clicking Add button and selecting menu Source (1) is opened form – Add External source.
The New external source is added by Name and Label. Label appears in the tree.
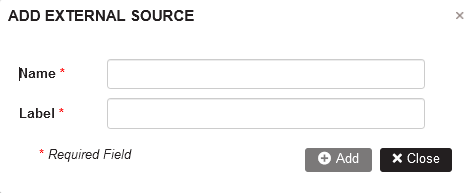
Figure 90: External sources - Add new external source
Selecting some source in the tree and clicking Add button and selecting the menu Tag Type is added new tag type of the source.
The New tag type is added by Name and Label. The Option “Data will be fetched from external API” can be checked or not.
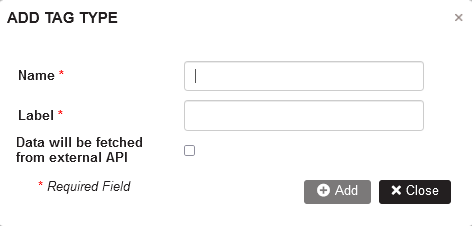
Figure 91: External sources - Add new tag type for source
Add source properties
The source properties are used to connect to the source.
Precondition: The source is added to the tree. Select source in the tree.
- Source Settings are shown at the right.
Click on the button Add new Property (1)
- The Add Property form is opened.
New property of the source is added by Name and Label (2). The label appears in Add/Edit Tag form when the external source is selected from the dropdown. Configure external sensor
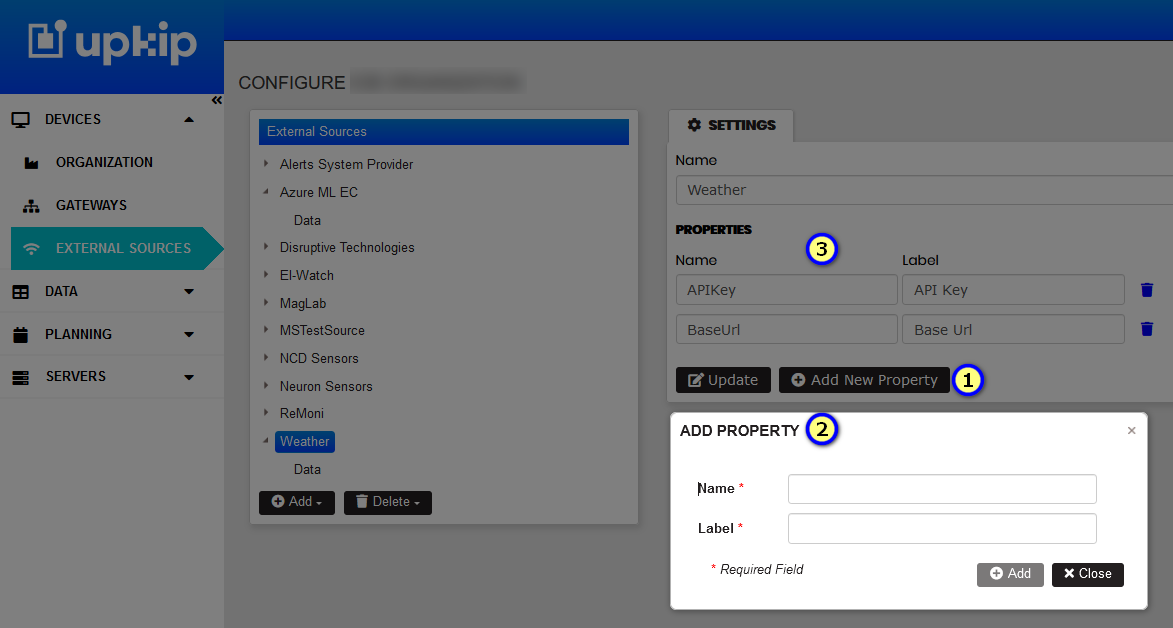
Figure 92: External source - Add new source property
After adding a new source property it appears in the source Settings form (3).
Add tag type properties
Precondition: The Tag type of the source is added by Add/Tag Type.
Select tag type of the source in the tree (1).
- The Tag type Settings form is opened.
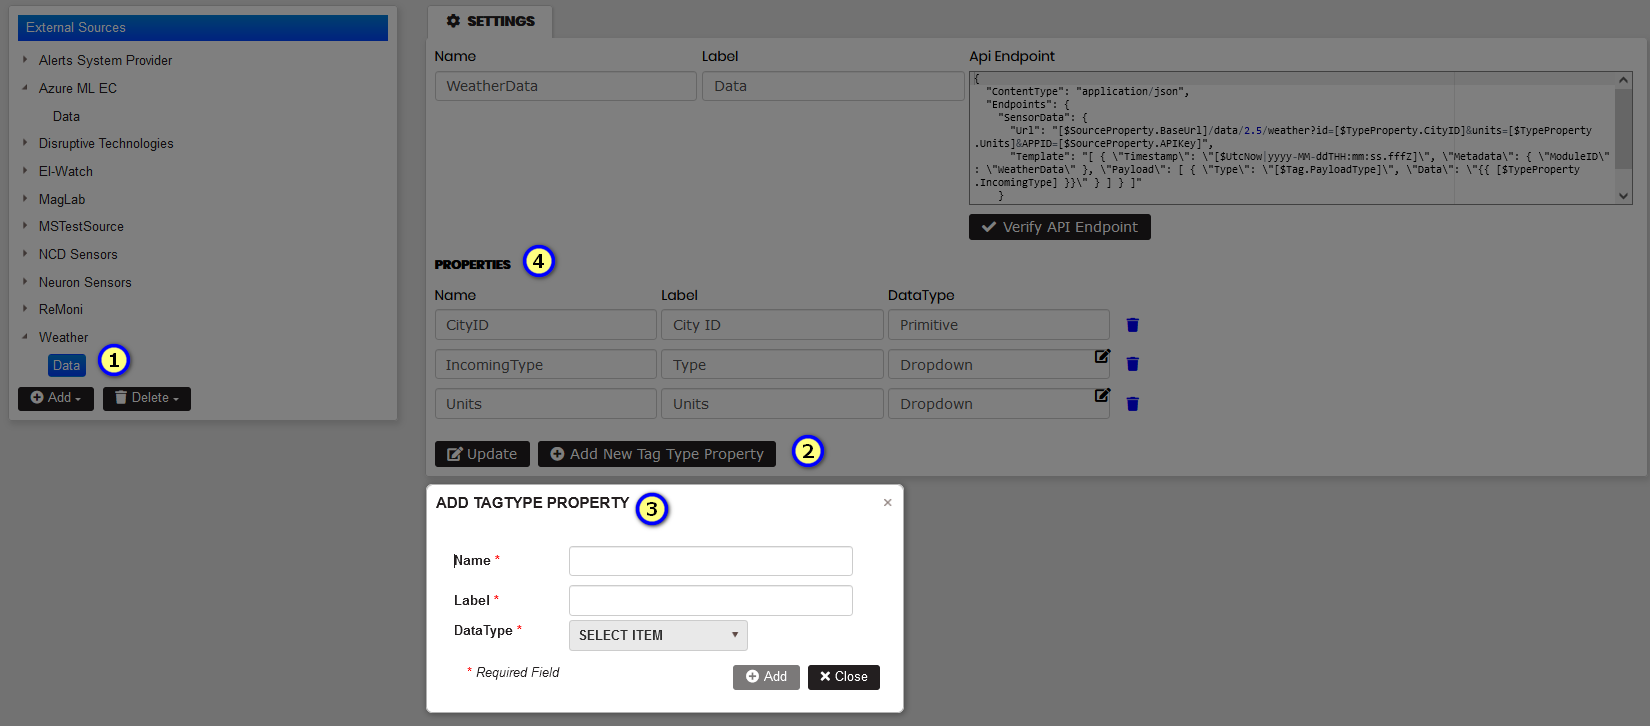
Figure 93: Tag Type Settings - Add tag type property
Click the button Add New Tag Type Property (2)
- The form Add Tag Type Property is opened (3).
Tag type is added by the Name , Label and Data Type with options Primitive or Dropdown.
When the Dropdown option has selected the values of the dropdown are added.
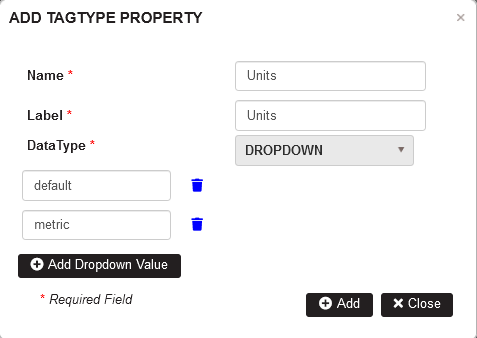
Figure 94: External source - tag type dropdown property
Entered dropdown values for the tag type property can be edited.
Verity API Endpoint template
In a tag type settings are specified Api Endpoints including template or only Template.
The template is used for Liquid JSON transformation of input message JSON to Upkip internal data format https://shopify.github.io/liquid/
Click the button Verify API Endpoint.
In the Verify API Endpoint templates form at the left paste the JSON with input message from the source.
At the right is the template for Liquid JSON transformation. Click on the Verify button.
- The verification of the input data have done.
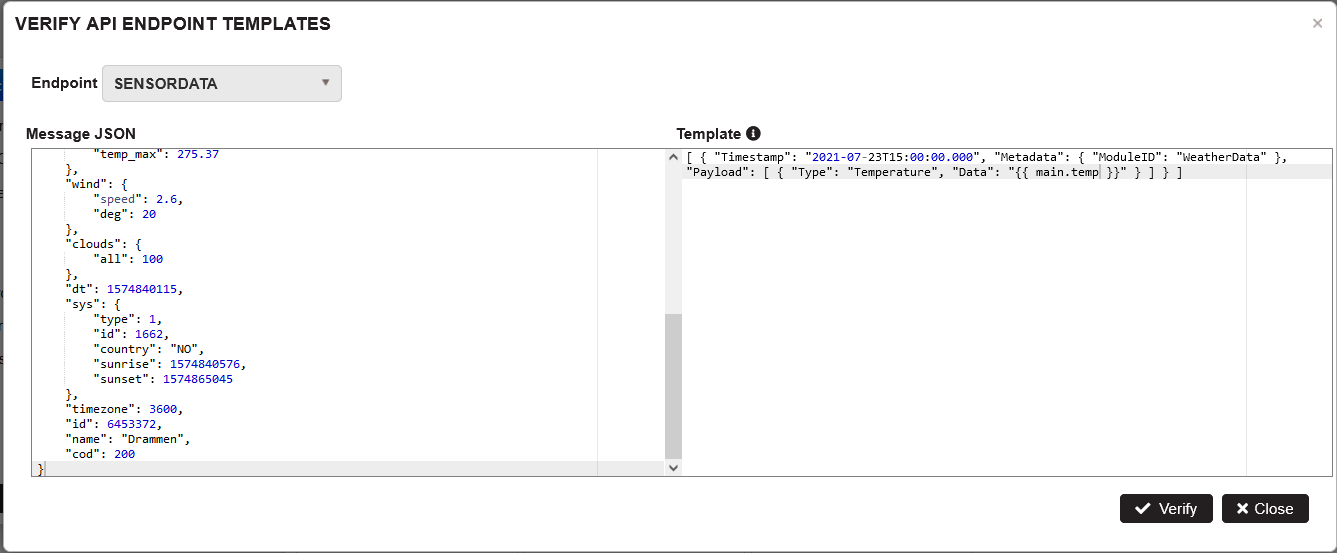
Figure 95: External source - Verify API Endpoint template
Delete source and tag types
Select some Source in the tree. Click the button Delete and select menu Source
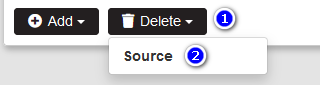
Figure 96: External source - Delete source menu
- Delete confirmation popup is opened
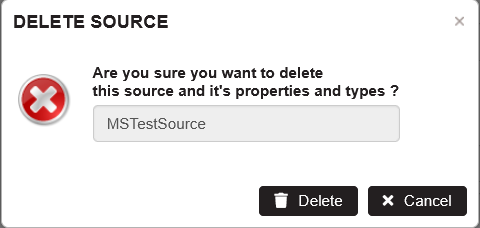
Figure 97: External source - Delete source confirmation
- Confirming with Delete deletes source with all it’s properties and types.
Select some Tag Type in the tree. Click the button Delete and select menu Tag Type
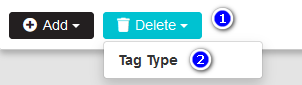
Figure 98: External source - Delete tag type menu
- Delete confirmation popup is opened
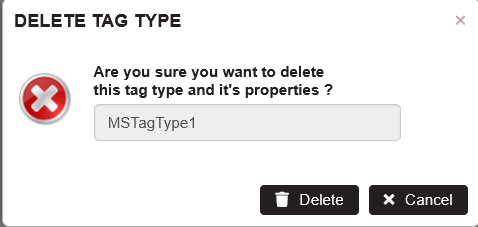
Figure 99: External source - Delete tag type confirmation
- Confirming with Delete deletes tag type and it’s properties.
Consumption Status
Overview
Consumption status (aka Power Status) is a type of machine status calculated based on the total power consumption of the target device.
The power cosumption metrics are analyzed per device using the K-means clustering method which is a type of complex ML algorithm. It is applied for a moving time window (e.g. last 7 days) for which power metrics are analyzed by the system to determine K-clusters of values for the power consumption. The result is a calculation of specific threshold levels.
In the common case 3 levels of power consumption rates are expected - StandBy, Idle, Active. Based on the analysis of clusters, threshold level is determined for each cluster and then later marked with specific status. Each threshold indicates the minimum level of power consumption for the machine to be considered in that status. Calculated thresholds are stored in special machine tags and the number of threshold tags determines the number of threshold levels to calculate for that machine.
With the help of these threshold levels different statuses are set for the machine. Status names are the IDs of the thresholds which are later mapped to user-friendly names and colors in the Visualization Portal dashboards and panels.
Required Tags and Data
Power Consumption
The basis for all calculations is the power consumption data of the machine. The analysis is based on the total power consumption which for three phase machines is the sum of power consumed accross all phases. This data should be stored in a tag with Label "Power Phase All" and data type of Float.
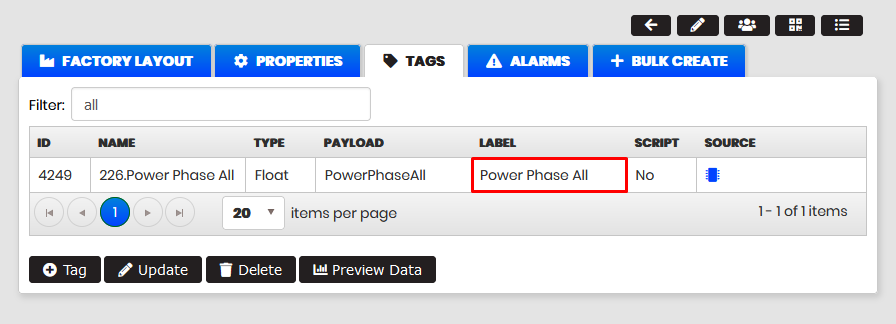 Figure 100: Total power consumption tag
Thresholds
The power consumption data is analyzed and split into groups based on the number of Threshold tags defined on the machine. Threshold tags are special tags which trigger the consumption status analysis. These tags should always have a Label starting with PowerStatusThreshold_ and data type of Float. For each threshold level two tags are required with the following labels: PowerStatusThreshold_X and PowerStatusThreshold_X_Avg.
- The "X" represents the level ID and later is used as a consumption status
- Each threshold level determines the minimum value for its status
- PowerStatusThreshold_X tags are used for status calculation
- PowerStatusThreshold_X_Avg tags are also requried though they are used for further analysis and simulation
In the general case, for good results at least three levels should be defined (0, 1, 2) in order to meaningfully split power consumption data. Threshold levels are evaluated once per day.
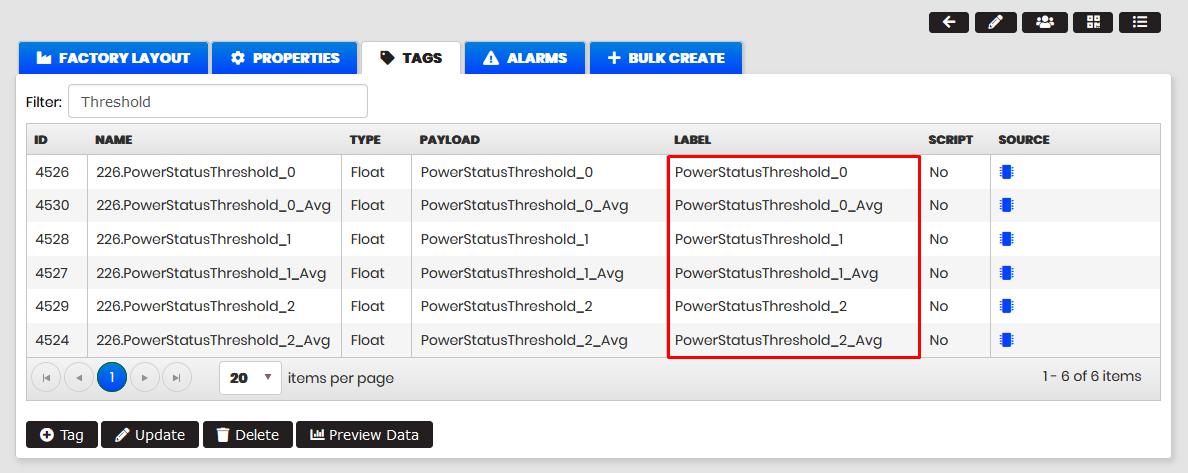 Figure 101: Threshold tags
A simplified example:
- Three threshold level tags are defined as follows:
- PowerStatusThreshold_0, PowerStatusThreshold_0_Avg
- PowerStatusThreshold_1, PowerStatusThreshold_1_Avg
- PowerStatusThreshold_2, PowerStatusThreshold_2_Avg
- Based on the above the clusterization algorithm calculates three levels of power consumption. Each level is marked with a dedicated status respectively: 0, 1 or 2
- As a result we have the following actual values:
- PowerStatusThreshold_0=1000Wh
- PowerStatusThreshold_1=2500Wh
- PowerStatusThreshold_2=5000Wh
- A new value for total power consumption is received of 1987Wh
- Based on the thresholds this is classified as a "0" state (1000 <= 1987 < 2500)
Consumption Status
The calculated consumption status is also stored in a special tag that needs to be created for the machine. This tag should have its Label set to PowerStatus and data type to Int.
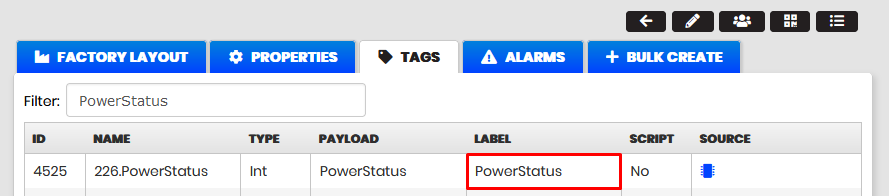 Figure 102: Power status tag
Visualization
Within the Visualization portal the Consumption Status is usually displayed with a Discrete Panel.
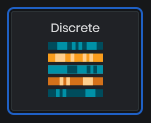 Figure 103: Discrete panel selector
In the common scenario the consumption status is extracted with the following query against the InfluxDB data source:
SELECT IntValue FROM telemetry WHERE $timeFilter and SensorID='$sensor' and Type='PowerStatus'
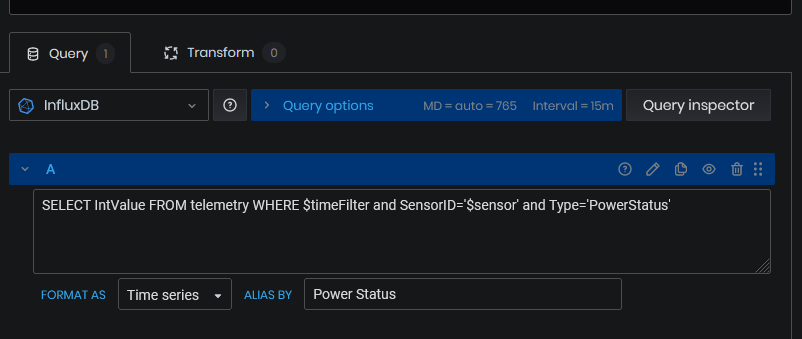 Figure 104: Data query
Through the panel's settings different statuses (e.g. 0, 1, 2, ...) are mapped to specific names and colors as shown below.
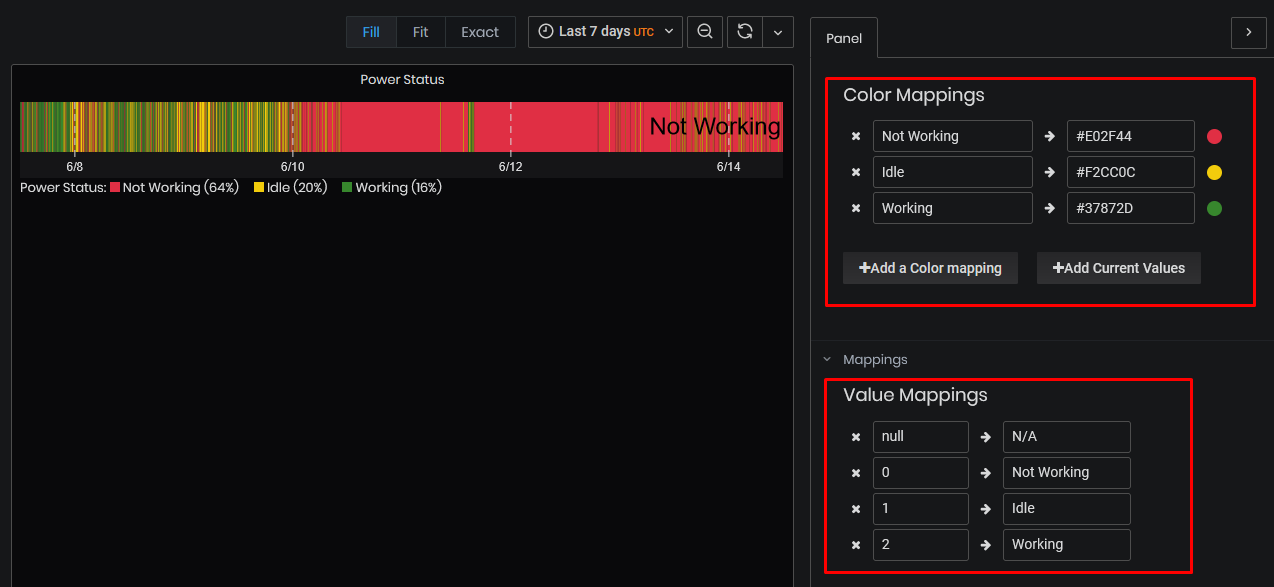 Figure 105: Color and name mappings
Device Control
Purpose: Send a command to a device(machine) when events occur. Events are configured using expressions and functions on machine data.
Precondition: Device (machine) must be configured in a gateway.
The event should be created in the Data/Events section following the steps Create new event.
Select a machine in the organization tree.
The Control tab is visible on the right side only if the machine has a gateway configured.
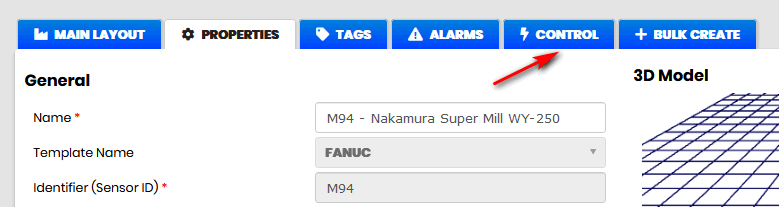
Figure 106: Open machine device control
Click the Control tab.
- The Device commands page is opened.
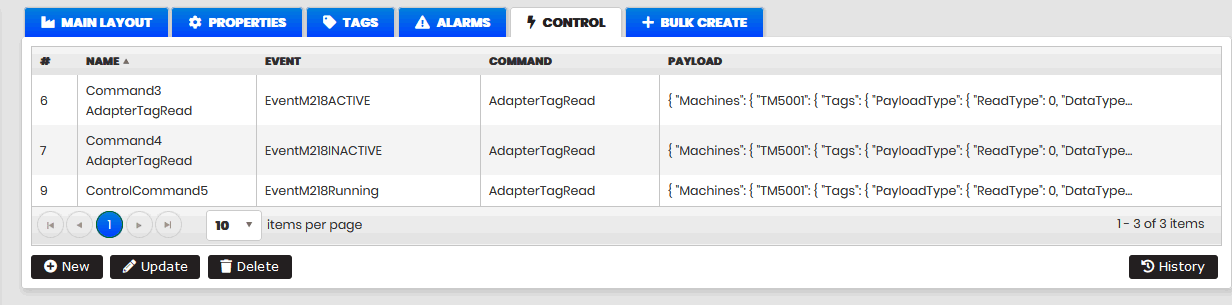
Figure 107: Device control commands page
Create new device control command
Click the New button to create a new control command.
- The Control command form opens.
- The machine gateway connection is executed, and the list of available commands is retrieved.
- The available commands are loaded in the Invoke command drop-down list.
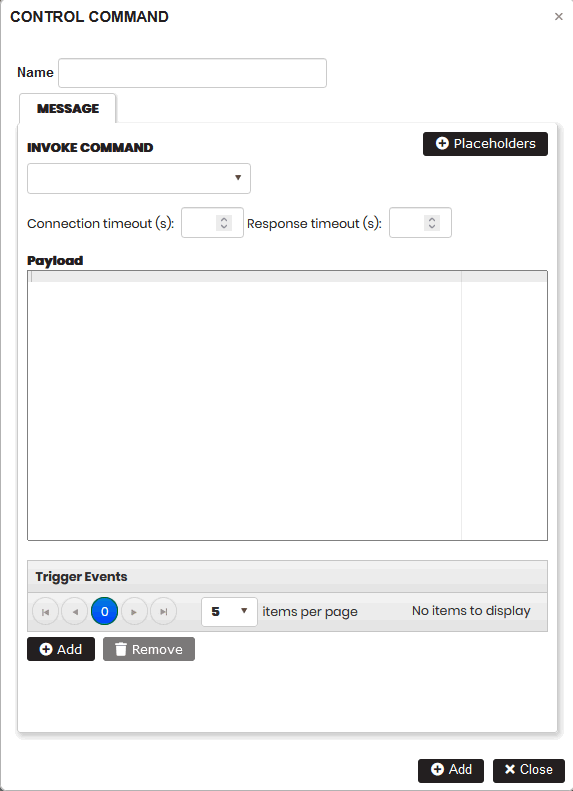
Figure 108: Create a new device control command
Fill in command name in the Name.
Select the command from the drop-down list (for example, AdapterReadTag).
- The JSON payload is loaded into the Payload field. Replace the Sensor ID with the machine ID.
In the Trigger Events section, click the Add button.
- A drop-down list of configured events in the organization is displayed.
Select one or more events from the list.
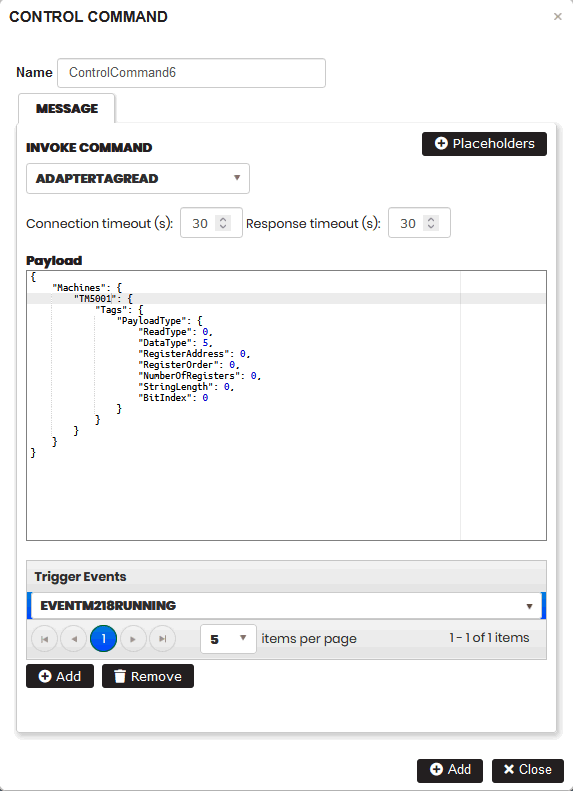
Figure 109: Configured device control command
Click the Add button.
- A new device control command is created and displayed on the page.
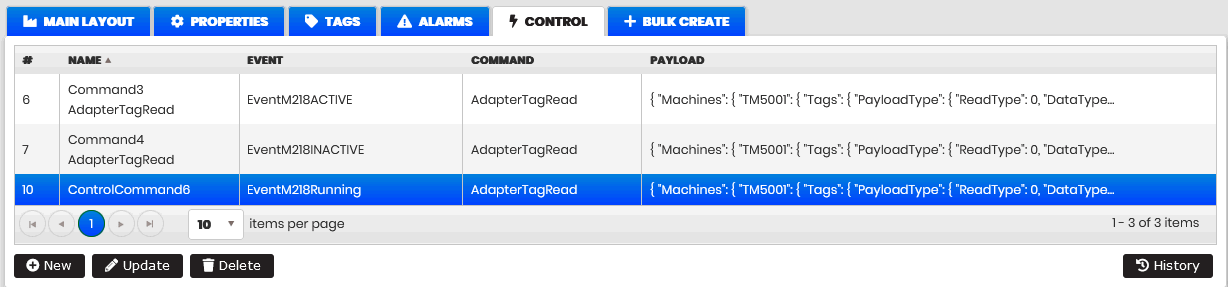
Figure 110: Device control commands page
Execute device control command
When the configured event is fired, the device command is executed.
To check the device command execution history, select the command from the table and click the History button.
- The Command history form opens. The user can see the history of the execution of the device command.
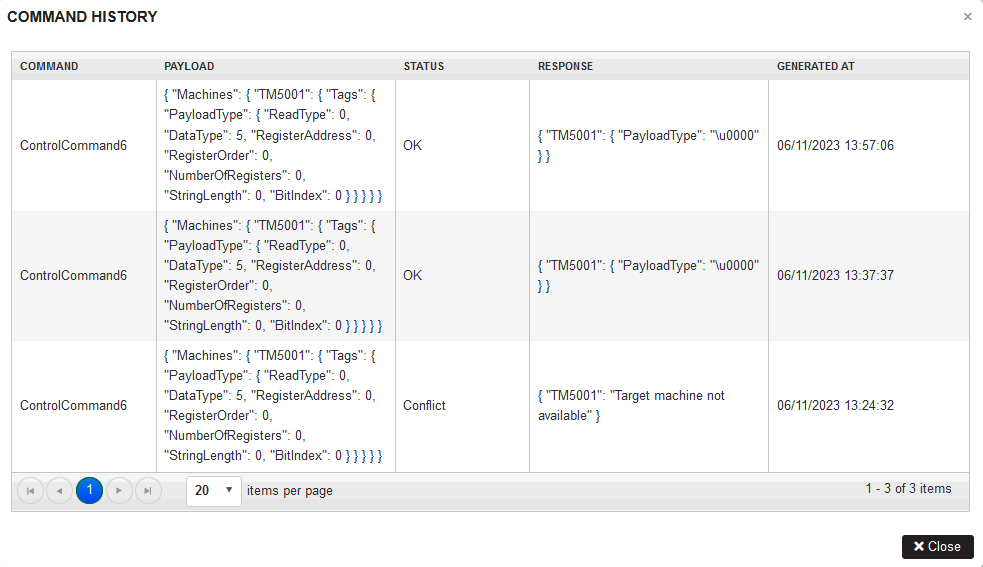
Figure 111: Device control command history
Delete device control command
Select the device control command from the list.
- The confirmation message is displayed.
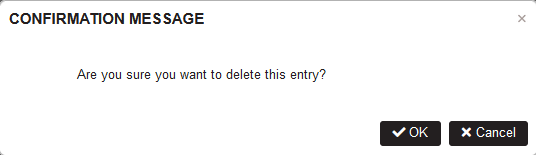
Figure 112: Delete device control command
Click the OK button.
- Device control command is removed from the list.