Overview
The section describes:
Solar panel configuration
Renewable energy comes from sources like the sun and wind, which naturally replenish and don't deplete. It's used for electricity, space heating, cooling, water, and transport. Its benefits impact the economy, environment, national security, and human health.
Solar energy is potent, providing heat, cooling, and lighting for homes and businesses. Industries use solar tech to diversify energy, boost efficiency, and cut costs.
In the Upkip Administration platform, it is possible to add solar panels to the organization tree.
Select the factory node. Click the Add button and select the Solar Panel menu.

Figure 1: Organization - add solar panel menu
- The Add solar panel form opens.
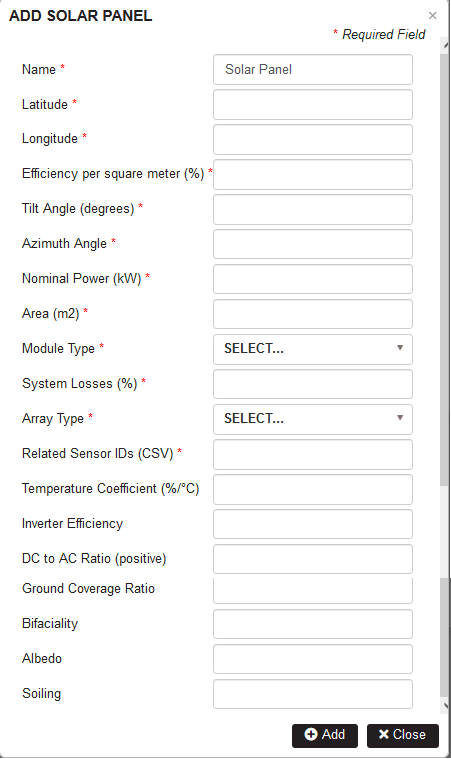
Figure 2: Add solar panel form
The required fields for solar panel definition are labeled with “*”.
Fill in the following fields:
-
Name (String) Add name of the solar panel
-
Latitude [-90,90] (decimal) The latitude for the location to use.
-
Longitude [-180,180] (decimal) The longitude for the location to use.
-
Efficiency per square meter [6,20] (%)
It refers to the amount of electricity a solar panel can generate in relation to the area it occupies. It measures how effectively the panel converts sunlight into usable electrical energy based on its size. A higher efficiency per square meter indicates that the solar panel can produce more electricity within a limited space.
| Solar panel type | Efficiency |
|---|---|
| Passivated Emitter and Rear Cell (PERC) | (Highest) 5% more than monocrystalline |
| Monocrystalline | 20% and up |
| Polycrystalline | 15-17% |
| Copper indium gallium selenide (CIGS) | 13-15% |
| Cadmium telluride (CdTe) | 9-11% |
| Amorphous silicon (a-Si) | 6-8% |
- Tilt angle [0,90] (degrees)
The tilt angle of a solar panel refers to the angle at which the panel is positioned relative to the horizontal plane. It determines how steeply or shallowly the panel is inclined with respect to the ground. This angle is crucial for optimizing the panel's exposure to sunlight and maximizing its energy generation by ensuring it captures sunlight effectively throughout the day and across different seasons.
- Azimuth angle [0,360] (degrees)
The azimuth angle of a solar panel refers to the horizontal direction in which the panel is oriented to face the sun. It represents the compass direction (measured in degrees) to which the front surface of the panel is pointed, typically relative to true north.
| Azimuth angle | 0 degrees | 90 degrees | 180 degrees | 270 degrees |
|---|---|---|---|---|
| PV (Photovoltaic) | North | East | South | West |
- Nominal power [0.5,500 000] (kW)
The nominal power of solar panels indicates the maximum electrical power output a solar panel can produce under ideal conditions. It helps consumers and professionals understand the panel's capacity and compare it to other solar panels.
- Area (m2)
Solar panel area refers to the physical surface area of a solar panel, typically measured in square meters (m²). A larger panel area can capture more sunlight, leading to higher energy production.
-
Module type {Standard,Premium,Thin-film} The choice of solar panel module type depends on factors like available space, budget, and desired energy output. Photovoltaic solar panel types are:
- Standard (Monocrystalline) solar panels are highly efficient and have a sleek design but come at a higher price point than other solar panels.
- Premium (Polycrystalline) solar panels are cheaper than monocrystalline panels, however, they are less efficient and aren’t as aesthetically pleasing.
- Thin-film solar panels are the cheapest but have the lowest efficiency rating and require a lot of space to meet your energy needs.
-
System Losses [-5,99] (%)
System losses in solar panels refer to the reduction in overall energy production caused by various factors within the solar energy system like shading, dirt and dust, temperature, inverter losses, etc. Minimizing these system losses is crucial for maximizing the efficiency and energy output of a solar panel system, ensuring it operates at its full potential.
-
Array type {Fixed–Open Rack,Fixed–Roof Mounted,1-Axis,1-Axis Backtracking,2-Axis}
-
Fixed–Open Rack: This is the most common type of solar panel array, typically seen in ground-mounted installations. Solar panels are fixed in place on open racks at a specific tilt angle and orientation. While cost-effective and easy to install, they don't track the sun's movement, so their energy production remains relatively constant throughout the day.
-
Fixed–Roof Mounted: These arrays are installed on building rooftops, either at a fixed angle or tilted to match the roof's pitch. While they don't adjust to follow the sun, they make efficient use of available roof space, often providing on-site energy generation for homes and businesses.
-
1-Axis: A single-axis solar panel array tracks the sun's movement in one direction, usually east-west. This tracking increases energy production compared to fixed arrays by optimizing the angle at which panels face the sun during the day. These systems are commonly used in larger solar installations.
-
Axis Backtracking: This variation of the single-axis system not only tracks the sun's east-west movement but also can backtrack or follow the sun's path backward when it's obstructed by shading. This feature further improves energy capture, especially in areas with variable shading conditions.
-
2-Axis: Two-axis solar panel arrays are the most sophisticated and efficient type. They track the sun both east-west and north-south, continuously adjusting the panel's orientation to maximize sunlight exposure. While these systems produce the most energy, they are complex and expensive, making them suitable for specific applications where high efficiency is critical.
-
-
Related sensor IDs. A separated semicolon list of machine IDs (in Upkip), that use the energy from this solar panel.
The additional optional parameters of the solar panel could be specified:
- Temperature coefficient [-0.3,-0.5] (%/°C)
It describes how a solar panel's electrical output changes in response to fluctuations in temperature. It is expressed as the percentage decrease in output for every 1-degree Celsius (°C) increase in temperature from 25°C. Solar panels are tested for their efficiency at 25°C, and that is why this is used as the reference point. For example, SunPower’s solar panels all have a temperature coefficient of -0.37% / °C. What this means is that for every 1°C above 25°C, SunPower’s solar panels decrease in efficiency by 0.37%.
- Inverter efficiency [90,99.5] (%)
The DC to AC ratio in a solar panel system refers to the relationship between the total installed capacity of the solar panels, typically measured in direct current (DC) watts, and the capacity of the inverter, which converts DC electricity to alternating current (AC) for use in homes or businesses. The values of DC/AC ratio between 1.1 to 1.3, mean that the total DC capacity of the solar panels should be 10% to 30% higher than the inverter's capacity.
- DC to AC ratio [1.1,1.6] (decimal)
The DC to AC ratio in a solar panel system refers to the relationship between the total installed capacity of the solar panels, typically measured in direct current (DC) watts, and the capacity of the inverter, which converts DC electricity to alternating current (AC) for use in homes or businesses. The values of DC/AC ratio between 1.1 to 1.3, mean that the total DC capacity of the solar panels should be 10% to 30% higher than the inverter's capacity.
- Ground coverage ratio(GCR) [0.01,0.99](%)
The GCR refers to the proportion of land or ground area that is covered by solar panels in a photovoltaic (PV) solar installation. A higher GCR means that more of the ground is covered by solar panels, potentially maximizing energy production but potentially reducing land use for other purposes.
- Bifaciality [0,1] (decimal)
The bifaciality of solar panels refers to the ability of certain solar panel designs to capture sunlight not only on their front surface but also on their rear surface. In other words, bifacial solar panels can generate electricity from both sides of the panel.
- Albedo (0,1) (%)
Albedo in Solar panels refers to the reflectivity of the panel's surface. Albedo measures how much sunlight is reflected off the surface of the solar panel rather than being absorbed to generate electricity. A higher value indicating greater reflectivity.
- Soiling [1,100] (%)
Soiling of solar panels refers to the accumulation of dirt, dust, debris, or other contaminants on the surface of solar panels, which can reduce their efficiency and energy production. It is a common issue that can impact the performance of solar installations over time.
Solar panel parameters usually are taken from the solar documentation and the installation of the solar panel.
After filling in the solar panel parameters, click the Add button.
- The solar panel is added to the organization tree.
HVAC device configuration
HVAC equipment consists of heating, ventilation, cooling or air-conditioning equipment. They work together with machines in shared areas, consuming energy.
Both automatic and manual optimizations calculate the energy consumed by HVAC systems.
In Upkip is possible to add HVAC device to the organization tree.
Select a department node. Click the Add button and select Sensor menu.
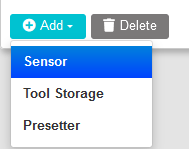
Figure 3: Organization - add sensor menu
Fill in data in the Name and Identifier (Sensor ID) fields.
For Template Name, select the HVAC template from the drop-down menu.
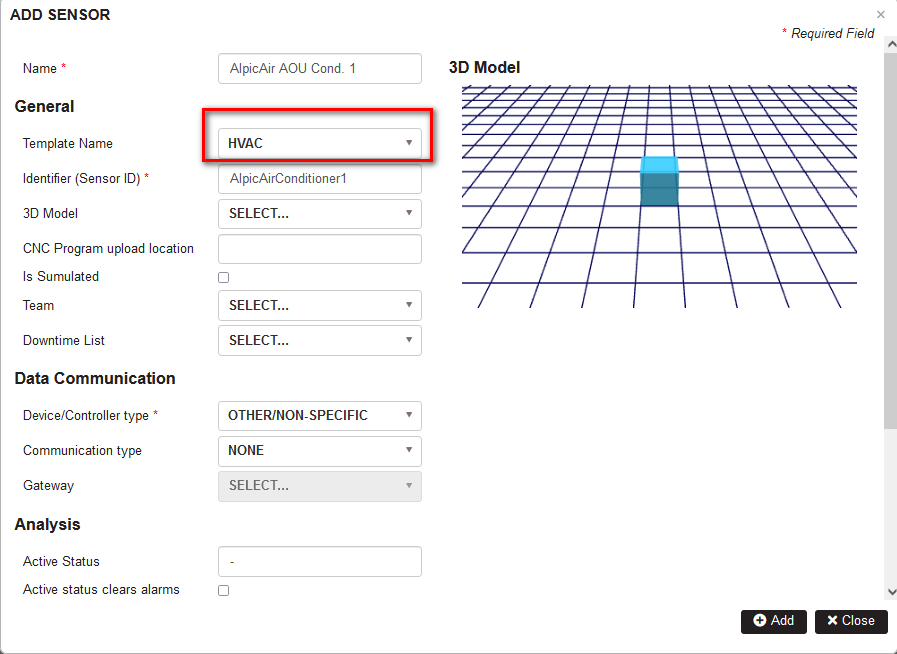
Figure 4: Add sensor form
Click the Add button.
- The HVAC device is added under the department node in the organization tree.
The energy of the HVAC device depends on the operation of the machines in the same room(zone).
To define this dependency, select HVAC device in the organization tree. Click the Dependencies tab.
Click the Add button.
- The row has been added. Select a machine from the drop-down menu, which contains all machines in the area (department).
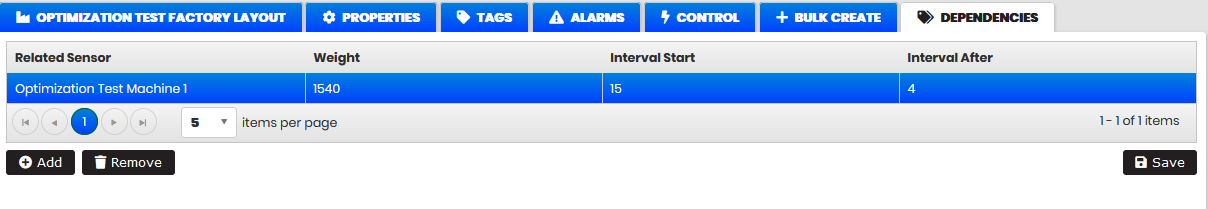
Figure 5: Add related machines to HVAC device
Click the Interval Start field and enter the number of minutes the HVAC device runs before turning on the machines.
Click the Interval After field and enter the number of minutes the HVAC device runs after turning off the machines.
Various sensors, such as ReMoni, are connected to HVAC devices for measuring power, voltage, and current. These sensors collect data from both the HVAC system and the machines using different tags.
The Upkip platform includes a power status analyzer tool that conducts a daily analysis of HVAC device power usage over a specified historical period. It calculates the baseline energy consumption when the HVAC operates alone, without any other machines.
When multiple machines run in the same room (zone) as an HVAC device, the HVAC consumes more energy than its baseline power consumption. The power status analyzer calculates this additional energy usage when the HVAC operates alongside other machines.
This energy is recorded in the Weight field in [W]. There is a possibility of manual change.
Automatic optimization
Purpose
The purpose of automatic optimization for production orders is to use renewable energy efficiently and reduce production costs.
If a factory has renewable energy sources like solar panels, the optimization aims to maximize their use and schedule production during low energy cost periods.
Automatic optimization covers all factories and machine orders within the organization, aiming for the lowest production cost based on local energy prices.
A genetic algorithm is used to achieve optimized planning results. Genetic algorithms are universal optimization techniques that can be applied to a wide range of AI and optimization problems where finding the best solution or exploring a complex search space is critical. They are particularly useful when other optimization methods may be less effective due to the complexity or nonlinearity of the problem.
Summary
Automatic optimization:
- Covers all factories with their machine orders in the organization.
- Can adjust production orders within or outside machine shift schedules based on the selected "Plan within machine shift calendar" option.
- Offers the choice to preserve order sequences or not, depending on the "Preserve orders sequence" option.
- Prioritizes order execution based on electricity prices for the next 24 hours and available solar energy in the factory.
Prerequisites
- There is solar panel in the factory connected to machines.
For details on how to configure a solar panel, go to Solar panel configuration
- Machines have set shift calendars.
For details on setting up machine calendars, go to Calendars.
Order planning
Manufacturing operations are usually planned in an ERP system. The Upkip platform automatically syncs with the ERP system and imports operation details into Upkip.
For details on how to view and filter operations from ERP, go to Operations.
Visually plan an operation such as a production order on a machine connected to a solar panel.
For details on how to schedule operations such as machine production orders, go to Production orders.

Figure 6: Planning - plan order on machine
The order is planned for a period without solar energy.
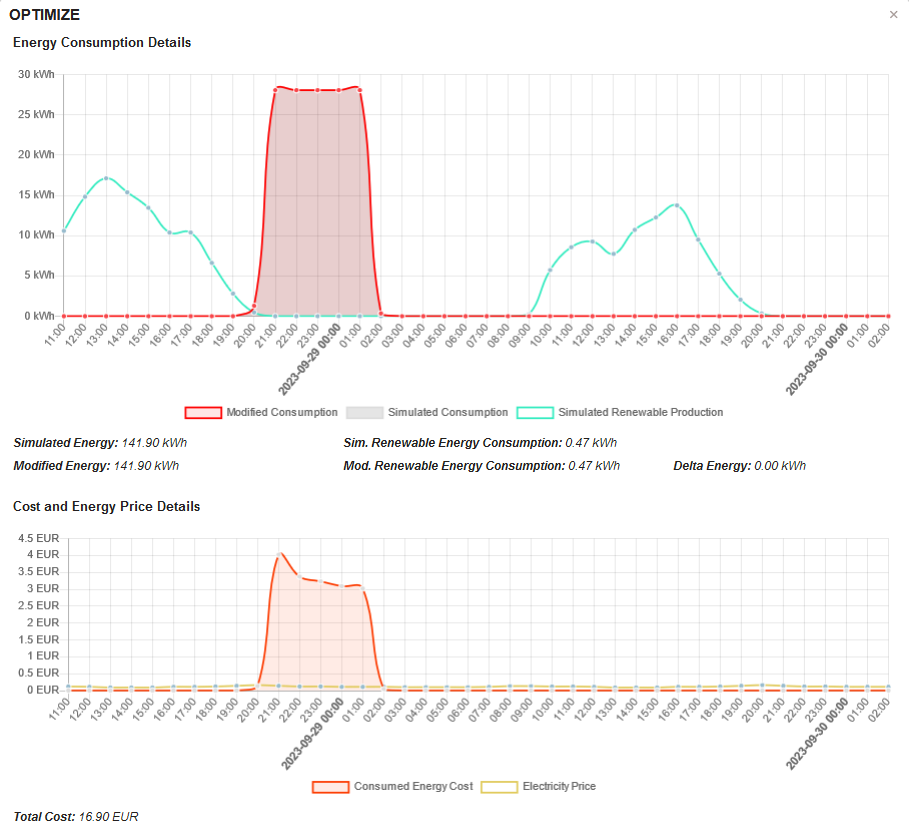
Figure 7: Simulated energy for machine and solar panel
Perform automatic optimization
The genetic algorithm works by shifting production orders to achieve the optimization goal.
Click the button Optimize.
- The Choose optimization type form opens.
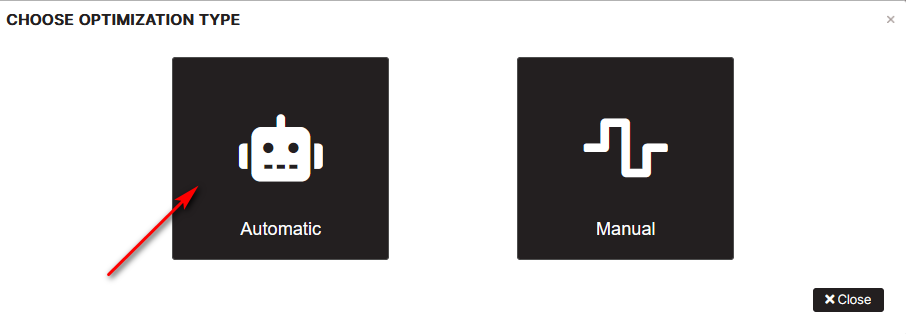
Figure 8: Optimization - choose optimization type
Click the button Automatic.
- The Optimize form with parameters for automatic optimization opens.
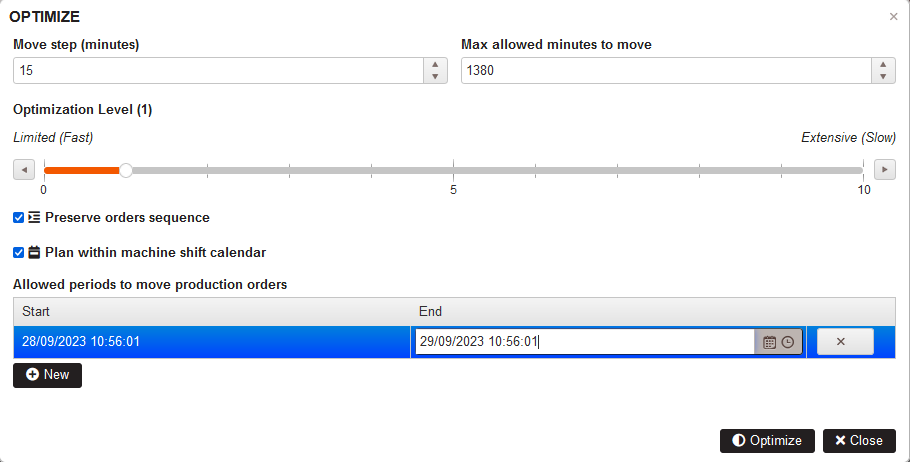
Figure 9: Automatic optimization form
- Move step (minutes)
It is the main parameter of the genetic algorithm and determines the step in minutes for moving production orders.
- Max allowed minutes to move
The parameter specifies the maximum period in minutes that production orders can be moved by the genetic algorithm.
- Optimization level [1,10] is a parameter to find more optimal results. The optimization level could be chosen between 1 and 10.
A higher optimization level results in finding more optimal results but takes more time.
A lower optimization level results in finding less optimal results and takes less time.
- Preserve orders sequence
If checked, the genetic algorithm when moving orders will keep their sequence in the schedule.
If unchecked, the genetic algorithm when moving orders is possible to change their sequences in the schedule.
- Plan within machine shift calendar
If checked, the genetic algorithm will only move orders within machine calendar shifts.
If unchecked, the genetic algorithm will be able to move orders outside the machine shift calendar.
- Allowed periods to move production orders
The user can define time periods by start and end time in which the genetic algorithm is possible to move the production orders.
It is possible to change some optimization parameters.
Click the button Optimize. Wait to show the results.
- Optimization results are shown in the green box.
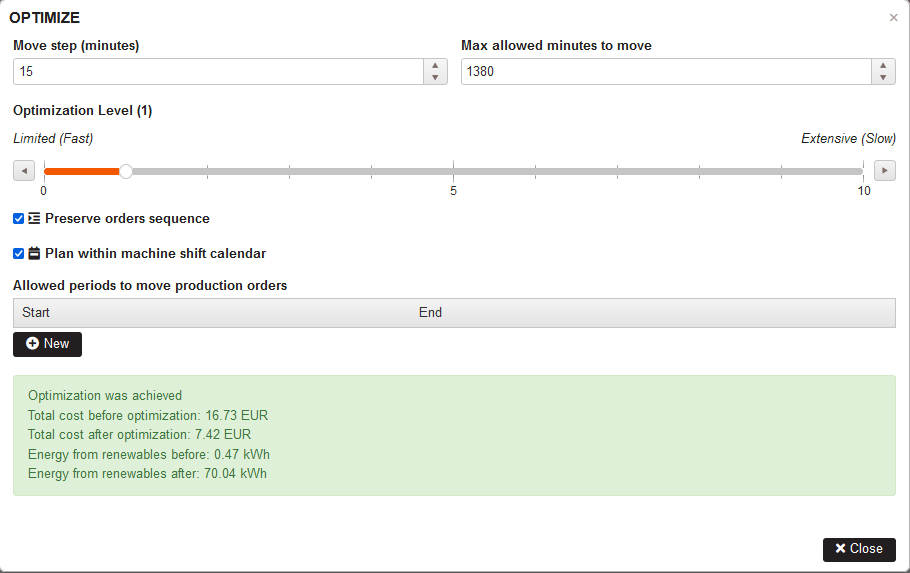
Figure 10: Automatic optimization results
Automatic optimization results
HVAC device's baseline power and its weight (additional energy consumption with machines running) are combined with machine energy usage.
HVAC energy consumed during the specified Interval start time and Interval after time in minutes is calculated based on the HVAC baseline energy consumption. For details see HVAC device configuration.
The calculated HVAC energy is factored into the genetic optimization algorithm alongside machine consumption.
Automatic optimization aims to shift production orders for more efficient energy use.
Automatic optimization results.
- Production orders are moved through a genetic algorithm using the parameters in optimization form, seeking more optimal results with energy costs.
- If solar power is available, orders are scheduled to use it.
- In the absence of solar energy, the algorithm seeks times with lower energy costs.
- After optimization, energy costs for production orders are minimized.
 Figure 11: Rescheduled order after automatic optimization
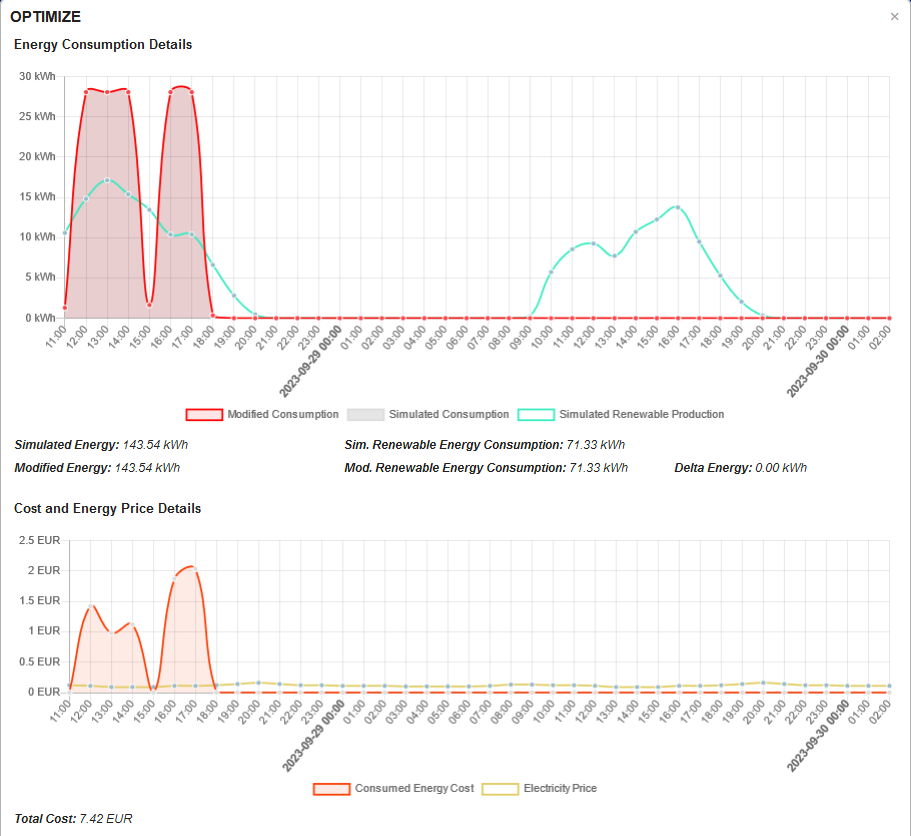
Figure 12: Energy consumption and price after automatic optimization
For our case, production order is moved from 21:00 to 12:00 after automatic optimization. During this period, energy from a solar panel is used. The total cost after optimization is reduced twice. Using energy from renewable sources has increased a lot.
Manual optimization
Purpose
Users can manually adjust power consumption within a given period.
The goal of manual optimization for planned production orders is to minimize deviation from user-defined energy consumption.
To achieve optimized planning, a Genetic algorithm is employed, offering versatile solutions for various AI and optimization problems, especially those complex or nonlinear.
Manual optimization focuses on the selected factory and its machine production orders.
Summary
Manual optimization:
- Only the selected factory's production orders are optimized.
- Optimization and order adjustments occur within the machine calendar shifts.
- Order sequences remain unchanged.
- Optimization is based on electricity distribution over time, not price.
- Orders are shifted to minimize deviation from user-defined energy consumption.
- The optimization period covers the next 24 hours.
Prerequisites
- There is solar panel in the factory connected to machines.
For details on how to configure a solar panel, go to Solar panel configuration
- Machines have set shift calendars.
For details on setting up machine calendars, go to Calendars.
Order planning
Manufacturing operations are usually planned in an ERP system. The Upkip platform automatically syncs with the ERP system and imports operation details into Upkip.
For details on how to view and filter operations from ERP, go to Operations.
Visually plan an operation such as a production order on a machine connected to a solar panel.
For details on how to schedule operations such as machine production orders, go to Production orders.

Figure 12: Planning - planned production order
Perform manual optimization
Click the button Optimize.
- The choose optimization type form is opened.

Figure 13: Optimization - choose optimization type
Click the button Manual.
- The Optimize form with parameters for manual optimization is opened.
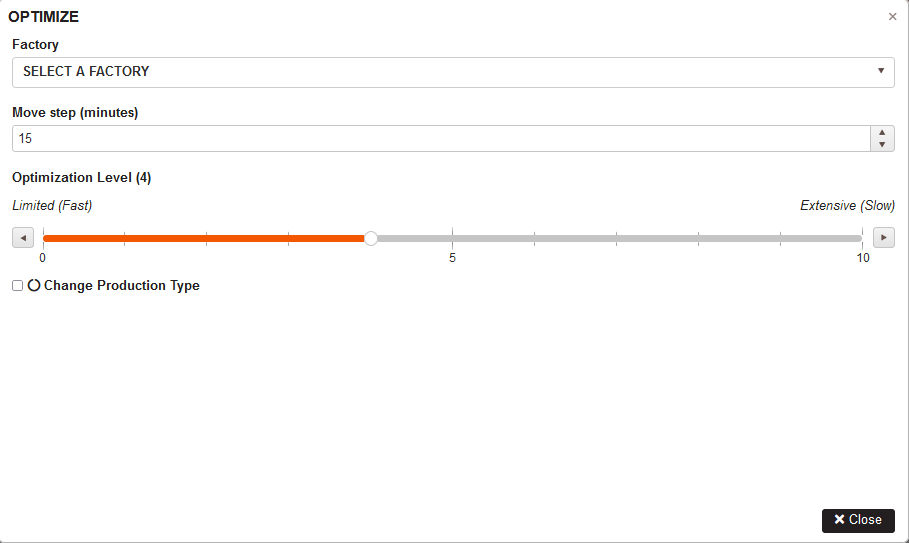
Figure 14: Manual optimization form
- Factory
The user must select a factory from the organization for which to perform manual schedule optimization.
- Move step (minutes)
It is the main parameter of the genetic algorithm and defines the step in minutes for moving production orders.
- Max allowed minutes to move
The parameter specifies the maximum period in minutes that production orders can be moved by the genetic algorithm.
- Optimization level [1,10] is a parameter to find more optimal results. The optimization level could be chosen between 1 and 10.
A higher optimization level results in finding more optimal results but takes more time.
A lower optimization level results in finding less optimal results and takes less time.
- Change production type
This option is displayed when different types of production orders are set for the organization (for example: Fast production or Energy efficient production, etc.).
If the option is checked, the genetic algorithm tries to change the production order types to find more optimal results.
If the option is not checked, the genetic algorithm skips the production type changes.
Select a factory from the drop-down menu. Factories are configured as nodes in the organization tree.
- The Next button appears in the form.
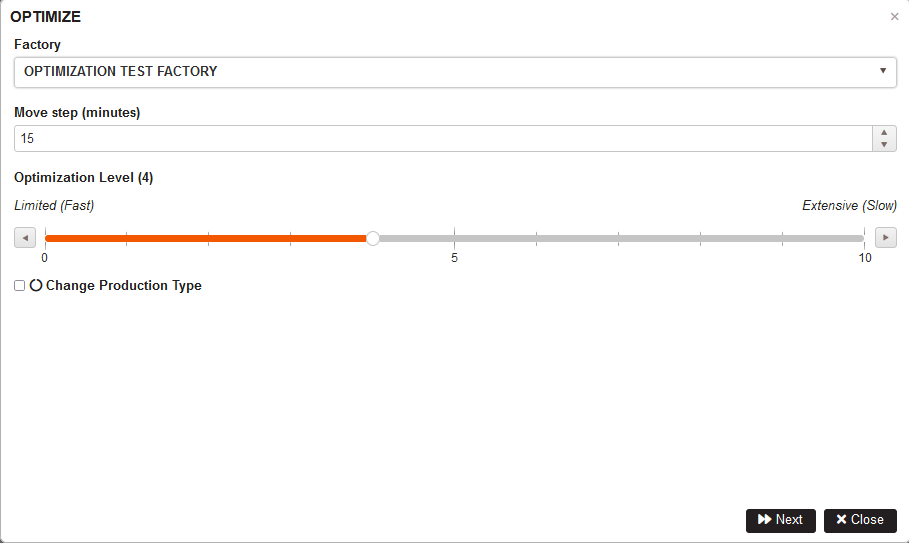
Figure 15: Manual optimization form with selected factory
It is possible to change some optimization parameters.
Click the Next button.
- The manual optimization form is opened.
- The top graphic displays Energy Consumption (kWh), with a green chart indicating solar panel energy and a red chart for simulated machine usage.
- The bottom graphic presents Energy costs and prices, forecasting energy prices for the next 24 hours based on the factory's GPS coordinates.
- The form also displays the total cost of order fulfillment in euros.

Figure 16: Manual optimization - graphics before modifying the energy consumption
User moves the red line for modified consumption.
By this way the user can limit the energy consumption in some periods to specified level of energy consumption.
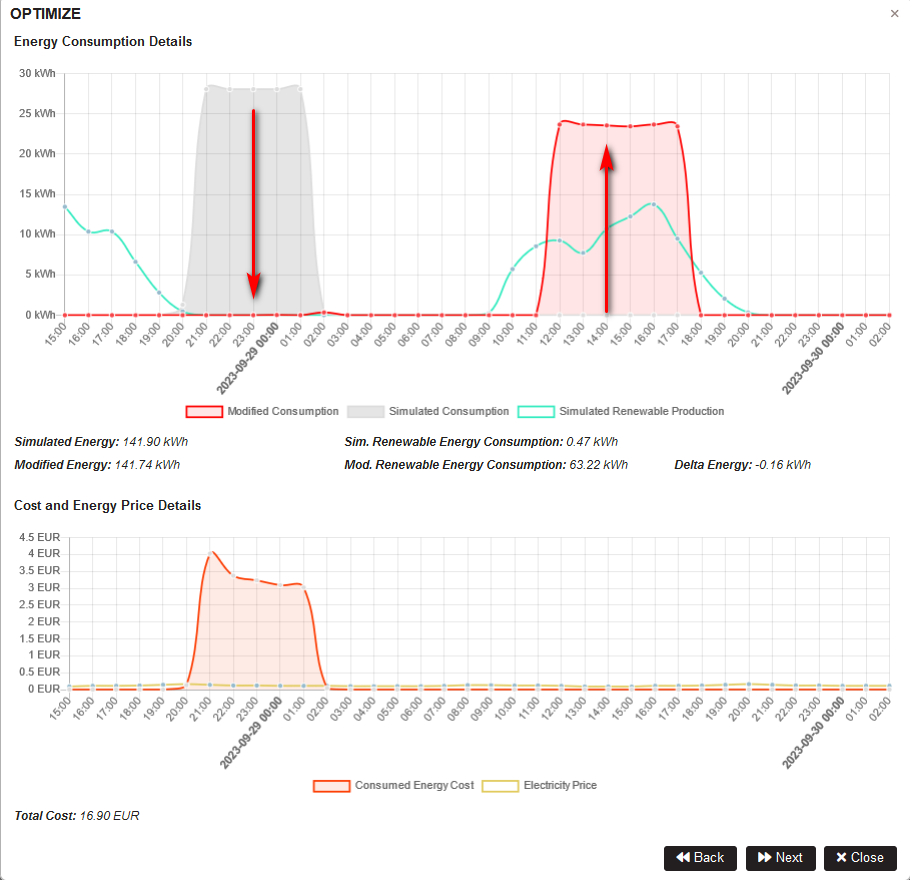
Figure 17: Manual optimization - modifying the simulated energy consumption
Click the Next button.
- The optimization started. Wait to finish.
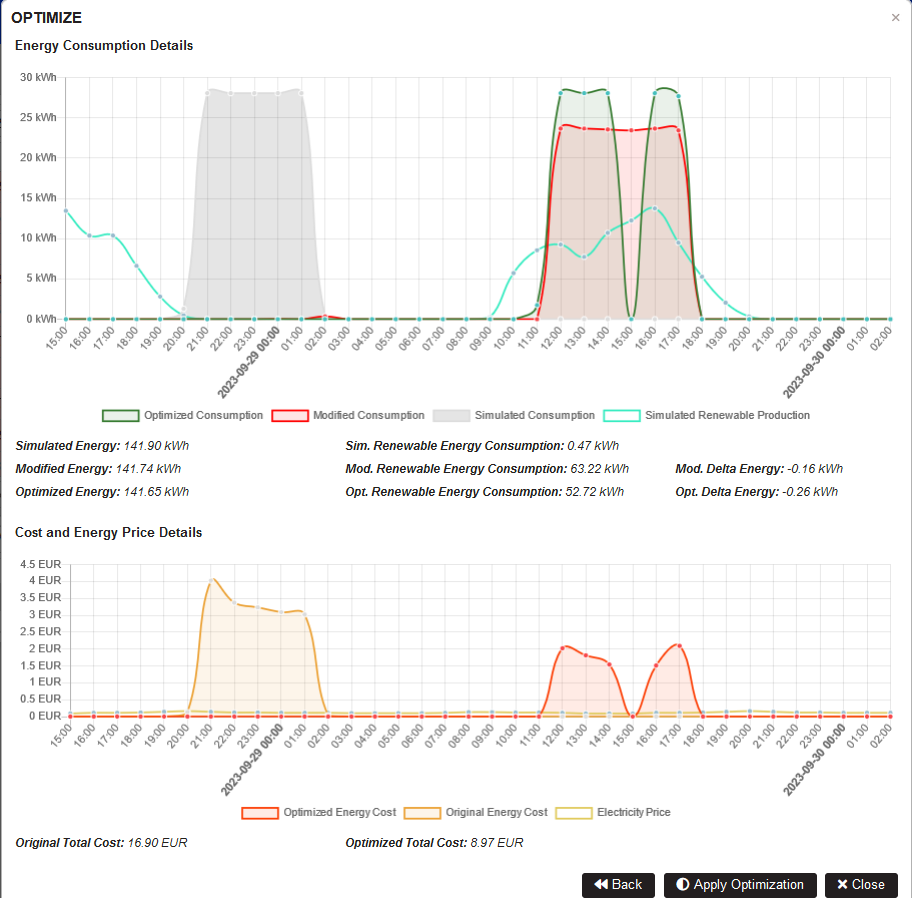
Figure 18: Manual optimization - modified energy consumption and price after optimization
After completing optimization:
- The results display the optimized energy consumption and price.
- In the top chart, a dark green line represents the shifted orders' optimized consumption, which should adhere to the user-defined limits.
- The initial simulated consumption remains visible as a grey background in the chart.
- The original and optimized total costs are depicted as charts and provided as numerical values at the bottom of the display.
If the user clicks the button Apply Optimization, the order will be moved to the hours with optimized consumption.
- The success form is displayed.

Figure 19: Optimization - success message
Close the message. Then Close the Optimize form. View the order in the plan.
- The planned order is shifted to the optimized hours.

Figure 20: Planning - rescheduled order after optimization
Manual optimization results
In manual optimization:
- The goal is to minimize deviation from the user's energy consumption settings.
- The system includes HVAC baseline power and weight in machine energy consumption calculations.
- HVAC energy consumed within specified time intervals Interval start time and Interval after time are added to the total consumption.
- The user configures the energy settings visually.
For details see HVAC device configuration.
Manual optimization results.
- Focuses solely on the selected factory.
- The genetic algorithm minimizes deviation from the user's specified power consumption.
- It doesn't aim for lower energy costs but strictly limits energy consumption as per user settings.
- Orders are rescheduled to optimized time slots after the process.