Team Leader Menu
To open the Team Leader dashboards select Team Leader from the main menu.
- The Team Leader dashboards menu opens.
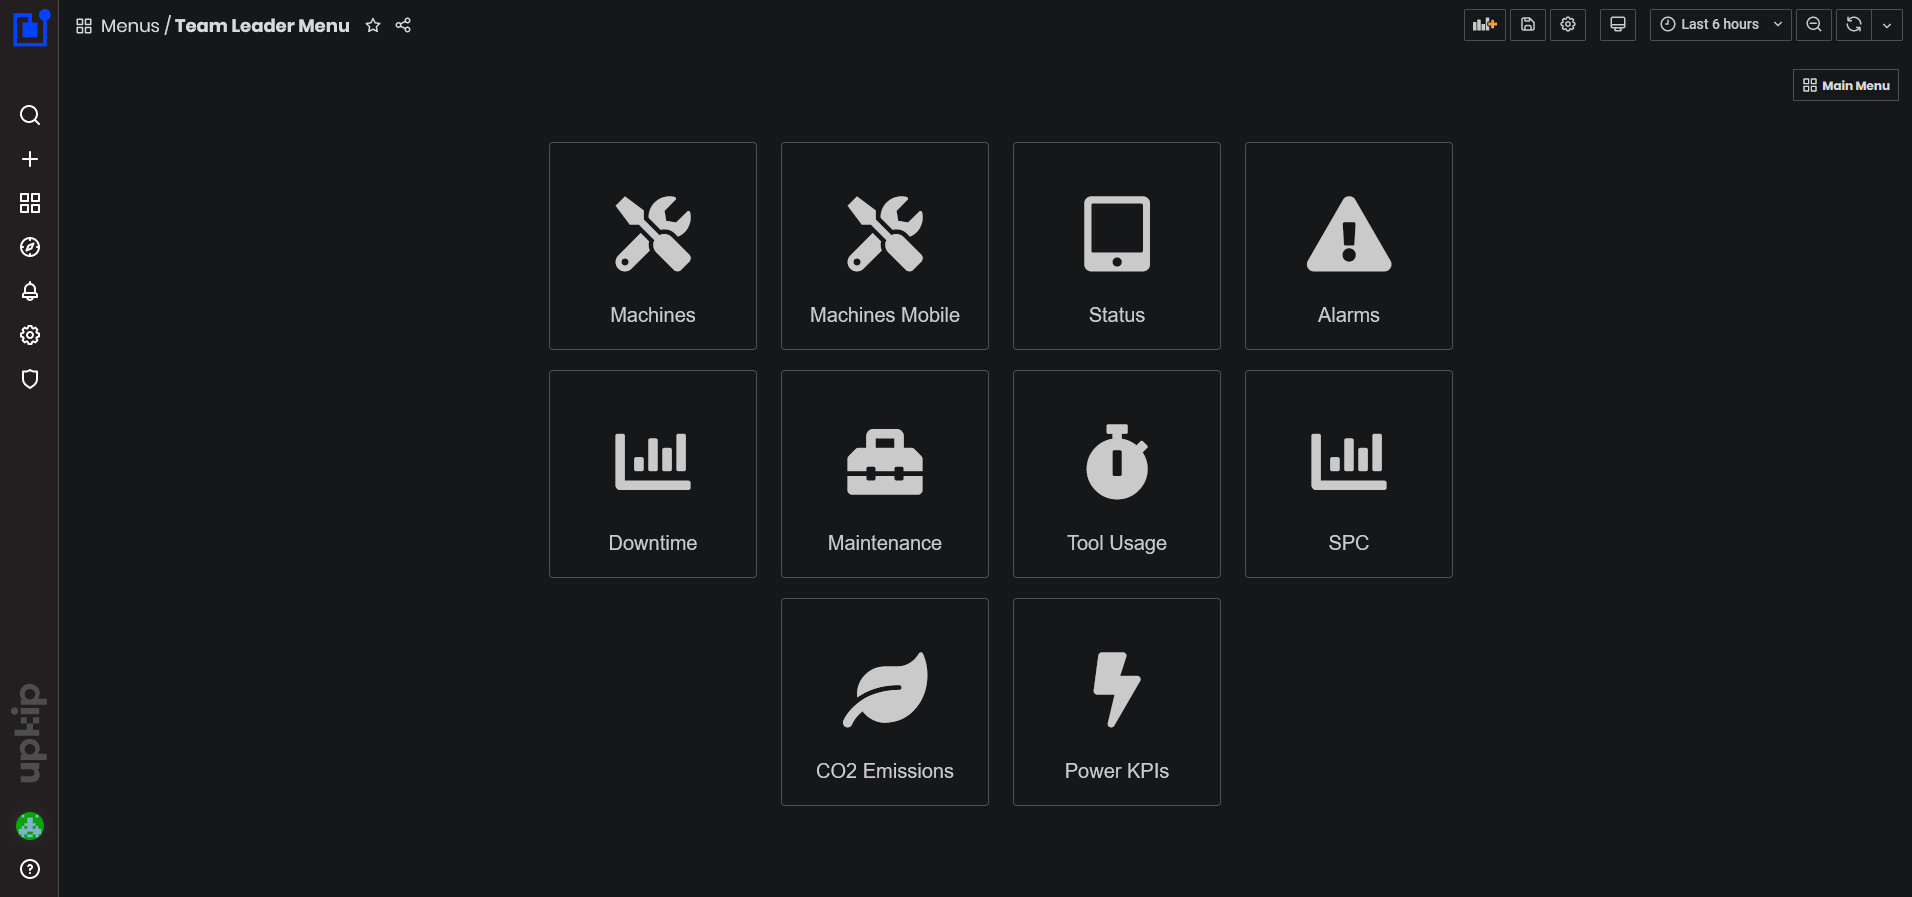
Figure 1: Team Leader dashboards
Machines Summary
To open the Machines Summary dashboard, select:
- As a user with role Operator: Operator/Responsive Desktop/Machines
- As a user with role Team Leader: Team Leader/Machines
- The Machines Summary dashboard opens with complete information.
The same roles can open the mobile version (lightweight information) of machines dashboard developed for tablet devices.
To open the Machines Summary Dashboard on tablets, select:
- As a user with role Operator: Operator/Machines
- As a user with role Team Leader: Team Leader/Machines Mobile
- The Machines Summary dashboard for tablets opens.
Purpose: The dashboard shows a summary and detailed information for all machines in the enterprise.
From this dashboard, users can get the following information:
- Total number and list of machines that are running, inactive, and not online.
- List of machines with their names, statuses, and duration of time with current machine status.
- Chart with overall machine statuses during the selected time period, filtered by selected department or type.
- Total number and detailed information about active alarms.
- Factory OEE and easily open detailed Factory OEE dashboard with OEE for each machine.
- Factory Utilization and easily open a detailed Factory Utilization dashboard with utilization for each machine.
- Total Factory Cost Deviation and easily open detailed Deviations Overview dashboard.
- List with Machine details: status, full machine name, work order, part name, operator name, and number. Links from machine name or work order can open machine OEE and work order OEE dashboards.
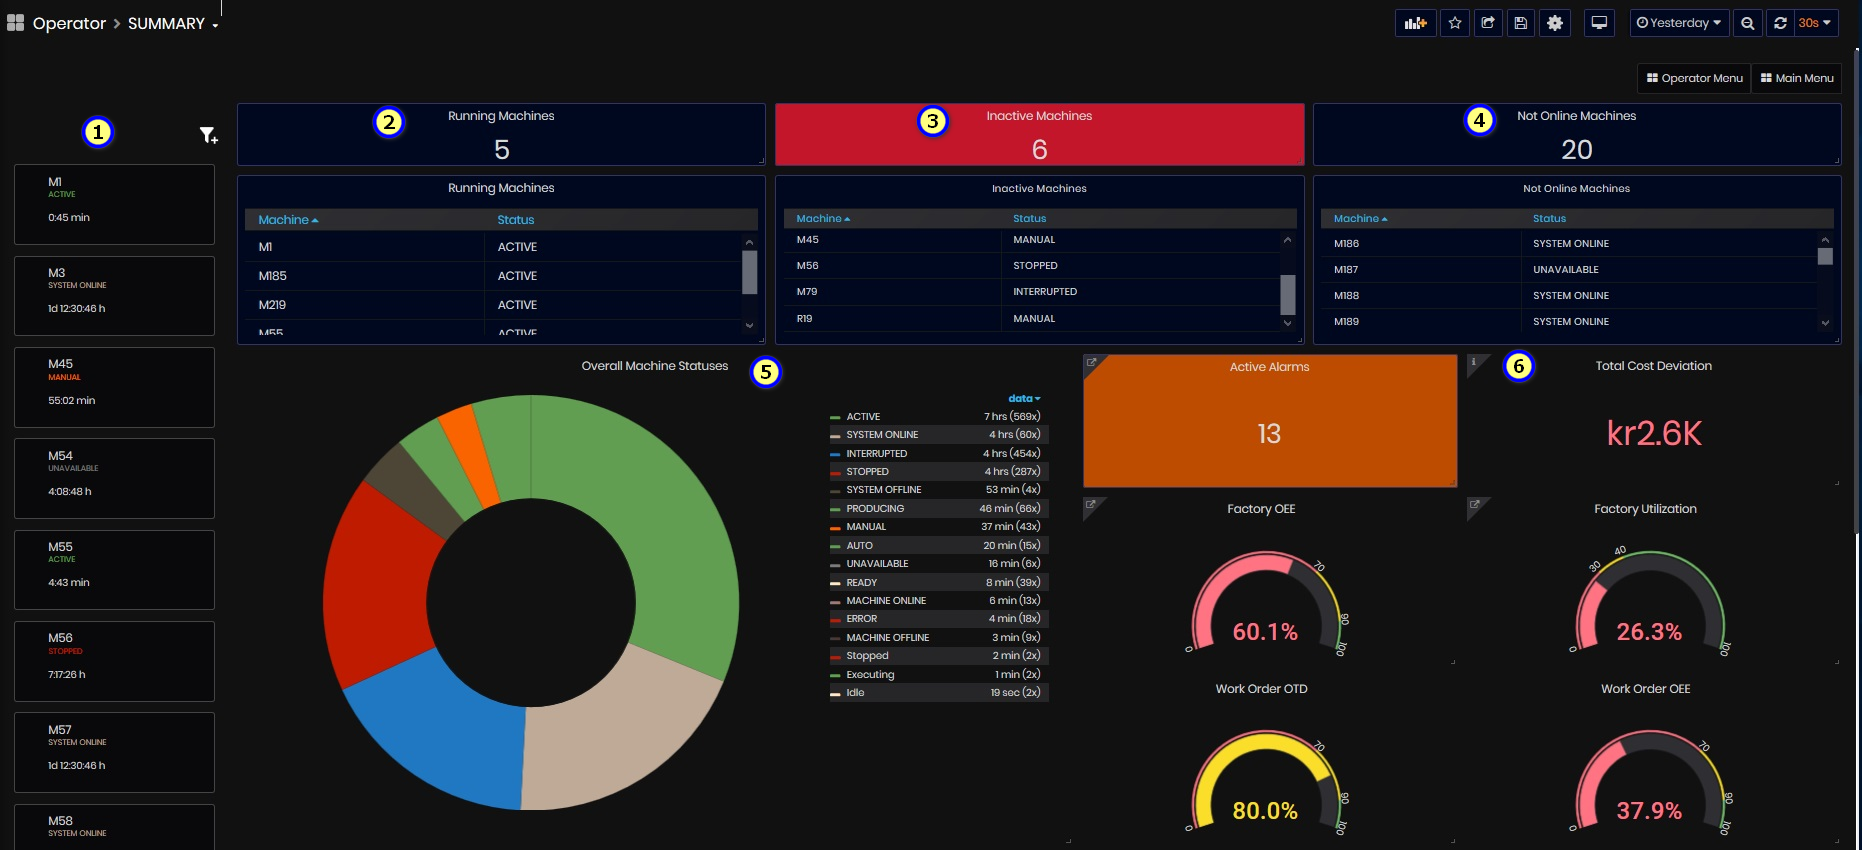
Figure 2: Machines summary dashboard top

Figure 3: Machines summary dashboard bottom
Machine dashboard shows:
Machines List
On the left side is a List of all machines with their Machine name, Status, Duration of time with current status. Clicking on some machine opens the Machine Details dashboard.
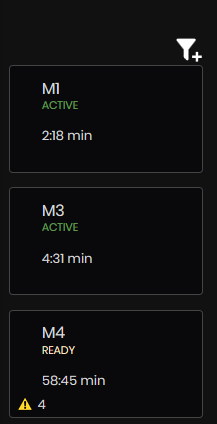
Figure 4: Machines summary dashboard machines list
The machine list can be filtered by Department, Type, and Team.
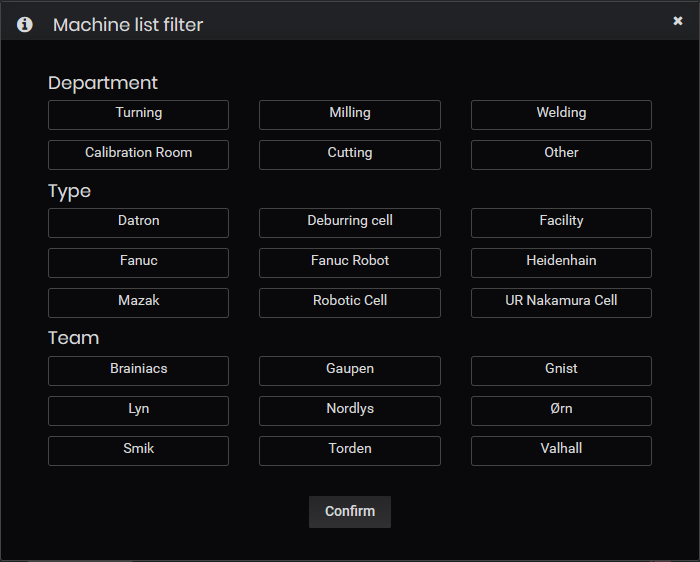
Figure 5: Machines summary dashboard filters
Running, Inactive, Not Online Machines
Panels for running, inactive and not online machines are updated according to selected time period (upper right)
- Running machines – Total number of running machines and list of all running machines with their statuses. The running statuses could be: Running|ACTIVE|NORMAL|Starting|AUTO|Completing|Completed|PRODUCING| Executing|READY|Preparing|Idle|Clearing|UnHolding|UnSuspending|Resetting
The section is updated according to the selected time period (upper right)

Figure 6: Machines summary dashboard - numbers of running, inactive, not online machines
-
Inactive machines - A total number of inactive machines and list of all inactive machines with their statuses. The inactive statuses could be: MANUAL|ERROR|STOPPED|Stopping|Stopped|Aborting|Aborted|Invalid| Suspending|Suspended|Holding|Held|INTERRUPTED|FEED_HOLD|PROGRAM_STOPPED|Pause|Init
-
Not online machines. Total number of not online machines and list of all machines, that are not online, with their statuses. The statuses could be: UNAVAILABLE|MACHINE|ONLINE|MACHINE OFFLINE|SYSTEM ONLINE|SYSTEM OFFLINE.
Pie Chart Overall Machine statuses with duration for each status for the selected time period.
Open drop-down and select one of the predefined periods.
-
Overall machine statuses are updated for the selected time period.
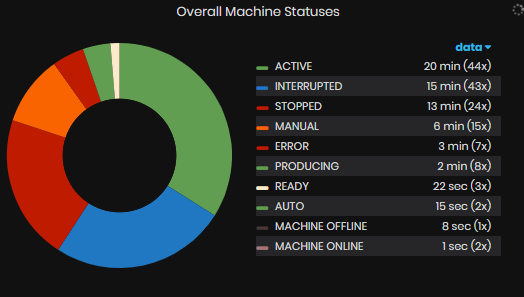
Figure 7: Machines summary dashboard - Overall machine statuses
On the Summary machines dashboard there is a panel with Factory KPIs:
- Total active alarms
- Total Cost Deviation (kr)
- Factory OEE (%)
- Factory Utilization (%)
- Work Order OTD (%)
- Work Order OEE (%)
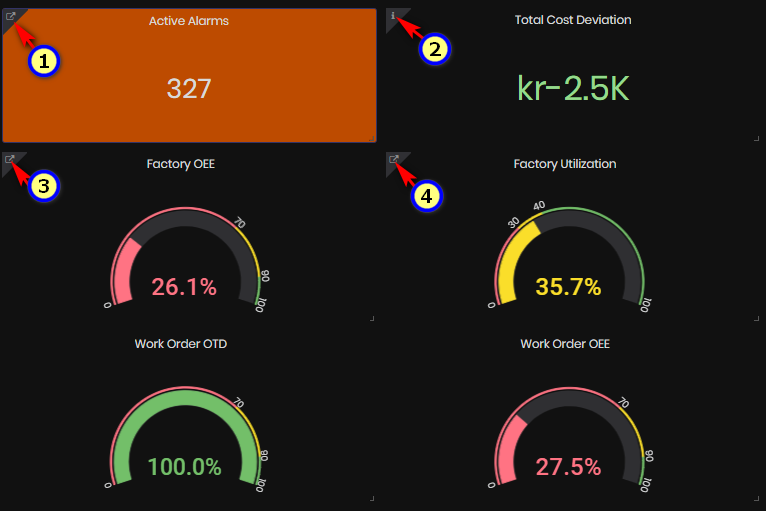
Figure 8: Machine summary dashboard - factory KPIs
From this section with enterprise KPIs is possible to navigate to other detailed dashboards.
Factory Active Alarms
The number of active alarms in the factory for the selected time period.
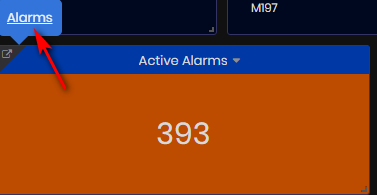
Figure 9: Machine summary dashboard - Active alarms
From the Active Alarms panel, click the top left link to open the Alarms dashboard.
Total Cost Deviations
The Total Cost deviation represents the deviation between actual time and planned time for the work orders planned to end in the selected time period.
Calculation:
- For each operation under the part:
- Calculated Operations Cost Deviations. See calculation of Operation Cost Deviation
- For each part from the work order:
- Calculated Part Cost Deviations. See calculation of Part Cost Deviation
PartCostDeviation += Operation[i].CostDeviation
- For a work order:
- Calculated Work Order Cost Deviation, as a sum of parts cost deviations. See calculation of Work Order Cost Deviations
WorkOrderCostDeviation += Part[i].CostDeviation
- For a factory total cost deviation:
- Calculated as a sum of cost deviations of orders planned to end in the selected time period.
TotalCostDeviation += WorkOrder[i].CostDeviation
Note: The result is calculated as duration, in hours. However in Grafana this value is multiplied by the “cost per hour” variable to display the KPI value as currency (NOK kr). Cost deviations can be positive or negative.
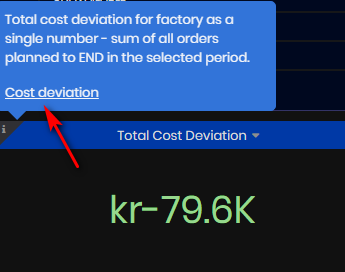
Figure 10: Machine summary dashboard - Total Cost Deviation
From the Total Cost Deviation panel, click the top left link to open the Deviations Overview dashboard
Factory OEE
Factory OEE is calculated as an average of machines OEE for the selected time interval.
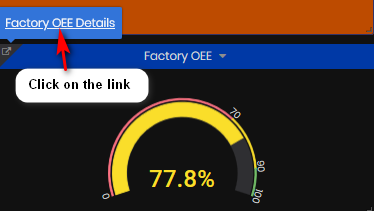
Figure 11: Machine summary dashboard - Factory OEE
From the Factory OEE panel, click the top left link to open the Factory OEE dashboard
Factory Utilization
Factory Utilization is calculated as an average of machines utilization for the selected time period.
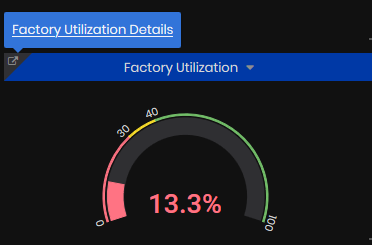
Figure 12: Machine summary dashboard - Factory Utilization
From the Factory Utilization panel, click the top left link to open the Factory Utilization Dashboard
Factory Work Orders OTD (On Time Delivery)
Work orders OTD is calculated as an average for the selected time period for the factory in percentage.
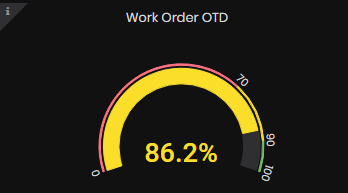
Figure 13: Machine summary dashboard - Factory Work Orders OTD
For details on how OTD is calculated go to Work Order OEE dashboard
Factory Work Order OEE
Work Order OEE is calculated as an average work order OEE for the orders active in the selected period in percentage.
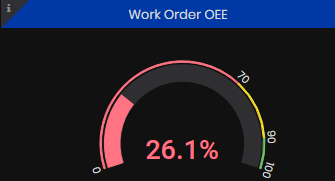
Figure 14: Machine summary dashboard - Factory Work Order OEE
For details go to the Work Order OEE dashboard
Machines List Details
The Machine Details panel shows list of machines with their Name, number, WorkOrder (WO), Part name (PART), Operator name (Op Name), Operator number (OPNr), and Status.
Click on the machine name, the link goes to the Machine OEE Details dashboard
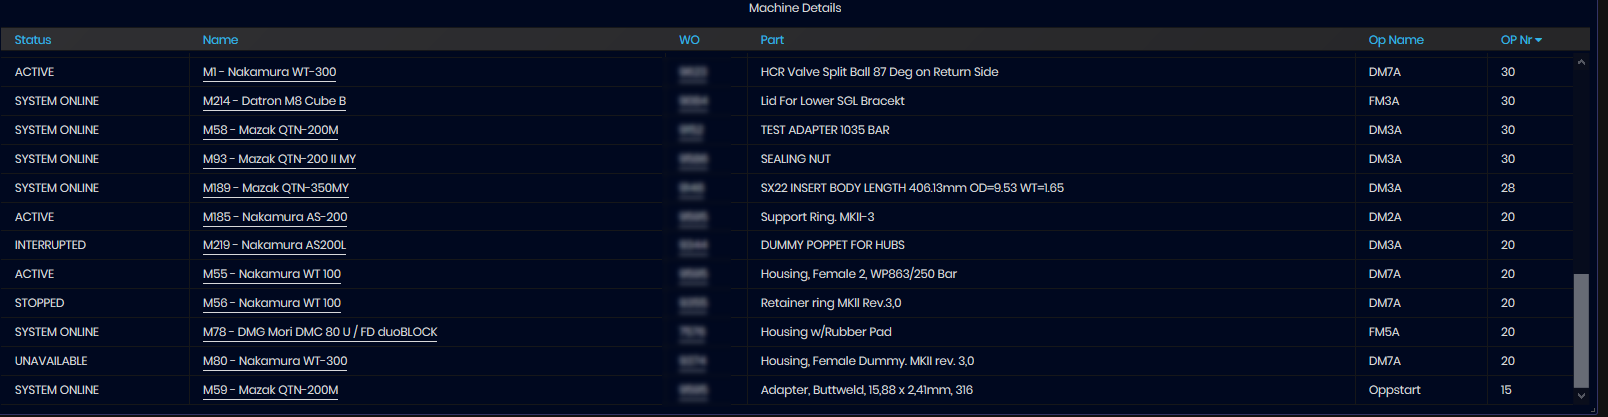
Figure 15: Machine summary dashboard -Machine Details
Factory Utilization
Open the Machines Summary dashboard. From the Factory Utilization panel, click the top left link.
- The Factory Utilization dashboard opens.
Factory Utilization (%) is calculated as an average of utilizations (%) for all machines in the factory (excluding machines with ‘No data’) divided on the number of machines.
This dashboard shows Machines Utilizations of all machines in the factory for the selected time period.
Machine Utilization (%) is calculated per day. This is the amount of time (in hours) a machine has been in some state (turned on) divided by 24 in ‘%’. The machine is in utilization mode when has some of the running or inactive statuses.
Calculation:
FactoryTotalUtilization += Machine[i].Utilization
FactoryUtilization = FactoryTotalUtilization / number of machines (with data)
From this dashboard, users can:
- Follow and view utilization of all machines in the factory for the selected time period.
- Filtering by machine type user can compare utilizations for machines of this type.
- Filtering by department user can view and analyze the utilization of machines in different departments.
- The user can open Detailed Utilization Dashboard for the selected machine.
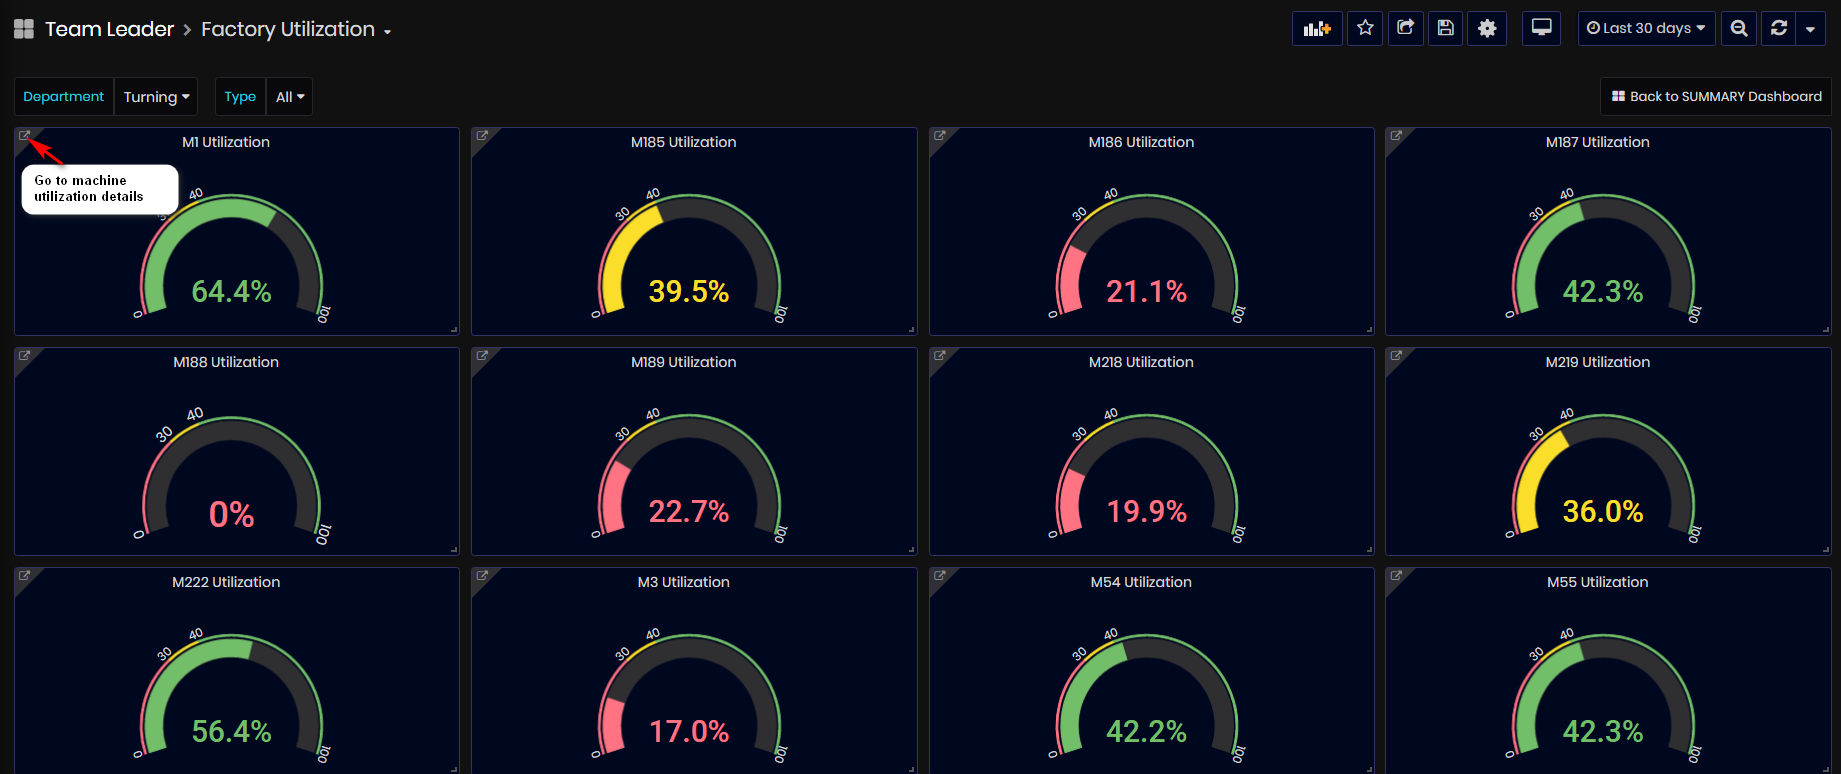
Figure 16: Factory Utilization dashboard
There is possible to filter machines by the following filters.

Figure 17: Factory Utilization dashboard - Filters
-
By Department and show machines utilization in selected department.
-
By Type and show machines utilization for the selected type of machines. There is possible to select from the following types: Datron, Deburring cell, Fanuc, Fanuc Robot, Heidenhain, Mazak, Robotic Cell, UR Nakamura Cell.
Users can change the time period by selecting one of the relative time periods or the absolute time period.
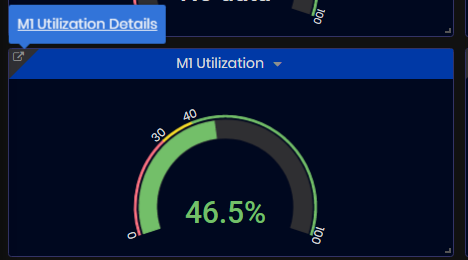
Figure 18: Change time period
- On dashboard, user can see average machines utilization for the selected time period
Click on the top left link for a selectede machine, opens the Machine Utilization dashboard.
Machine Utilization
To open the Machines Utilization dashboard select:
- As a user with role Operator: Main Menu/Operator/Machines.
- As a user with role Team Leader: Main Menu/Team Leader/Machines.
- From Machines Summary dashboard Factory Utilization panel by clicking the top left link.
- For а selected machine from Factory Utilization by clicking the top left link.
- The Machines OEE dashboard opens.
Machine Utilization (%) is calculated per day. This is the amount of time (in hours) a machine has been in some state (turned on) divided by 24 in ‘%’. The machine is in utilization mode when has some of the running or inactive statuses.
Running statuses: Running|ACTIVE|NORMAL|Starting|AUTO|Completing|Completed|PRODUCING| Executing|READY|Preparing|Idle|Clearing|UnHolding|UnSuspending|Resetting
Inactive statuses: MANUAL|ERROR|STOPPED|Stopping|Stopped|Aborting|Aborted|Invalid| Suspending|Suspended|Holding|Held|INTERRUPTED|FEED_HOLD|PROGRAM_STOPPED|Pause|Init
Calculation:
MachineActiveTime += (MachineTime(with running statuses) OR MachineTime(with inactive statuses))
Machine Utilization = MachineActiveTime(hours) /24 *100 (%)
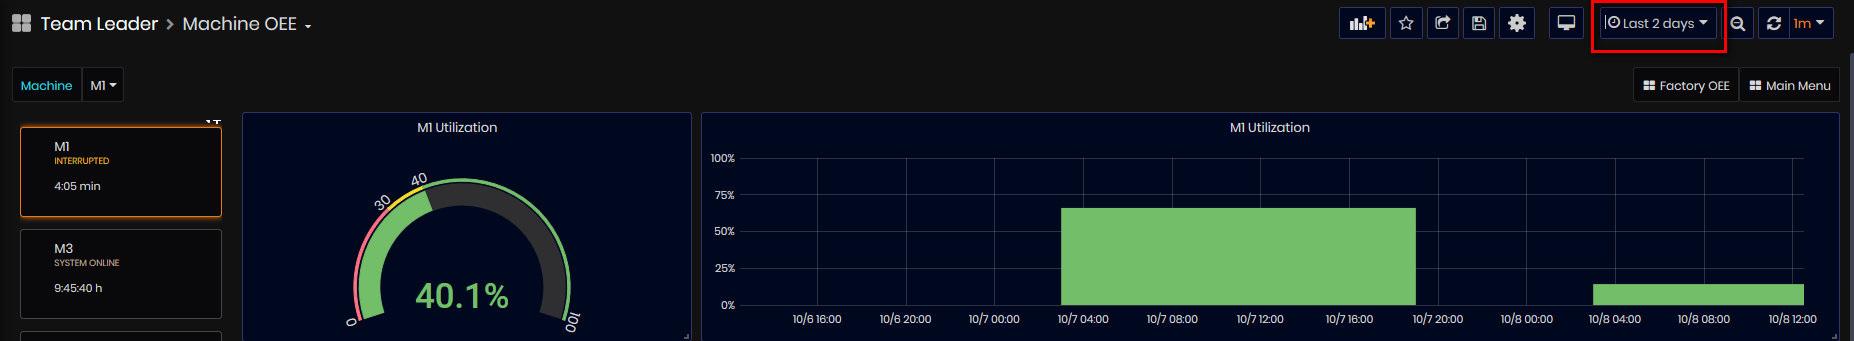
Figure 19: Machine OEE dashboard - Machine Utilization
From the Machine OEE dashboard, users can:
- View the average percentage of machine utilization for the selected time period.
- View and analyze machine utilization over the selected time period.
Machine Details
Precondition: Open the Machines SUMARY dashboard. Click the selected machine from the left side list.
- The detailed dashboard for the selected machine opens.
From a detailed machine dashboard user can:
- View the percentage of Machine OEE (%) for the last day in the selected time period.
- Open a detailed Machine OEE dashboard with the average percentage of machine OEE for the selected time period. On detailed Machine OEE dashboard is visible also machine utilization as an average percentage for the selected time period.
- Machine last downtime status, statuses, tool info and details.
- Create machine maintenance task.
- View the machine status timeline over the time in the selected time period.
- View some specific charts related to the machine type.
- View planned maintenance tasks for the machine during the next 30 days.
- See Predictive Maintenance (for some machines).
- View Reports - tool report, status report, program report for the selected time period; status summary and downtime summary for the last two weeks.

Figure 20: Machine Details dashboard
- At the top are listed: machine name, operator number, the current work order-part, operation name.
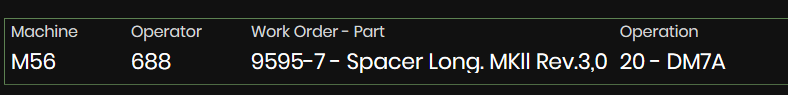
Figure 21: Machine details dashboard - Work order details
- Machine OEE section
This is the current OEE of the machine (%). It is calculated per day.
Clicking the top left link in Machine OEE panel opens the Machine OEE Details dashboard. The current OEE value can be visible if the select time period is Last 24 hours. The machine OEE is possible to view over the selected time period.
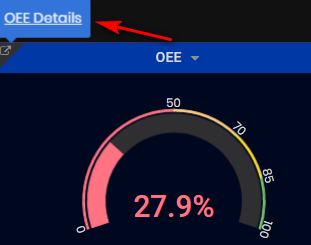
Figure 22: Machine details dashboard - Machine OEE
-
Last Downtime shows the last Downtime status of the machine.
-
Status shows the last status of the machine.
-
The machine's Work Order Log shows the current orders in the machine. Clicking Work Order Number link opens the Work Order OEE dashboard with the order loaded.
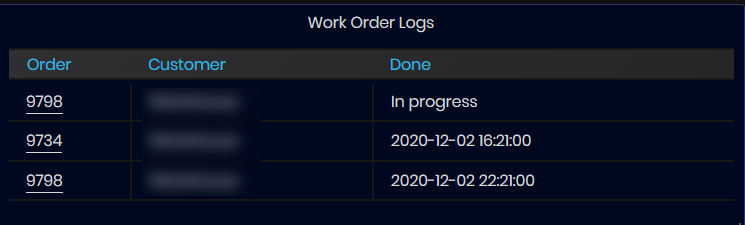
Figure 23: Machine details dashboard - Work Order Logs
- Create a maintenance request by clicking the Maintenance button.
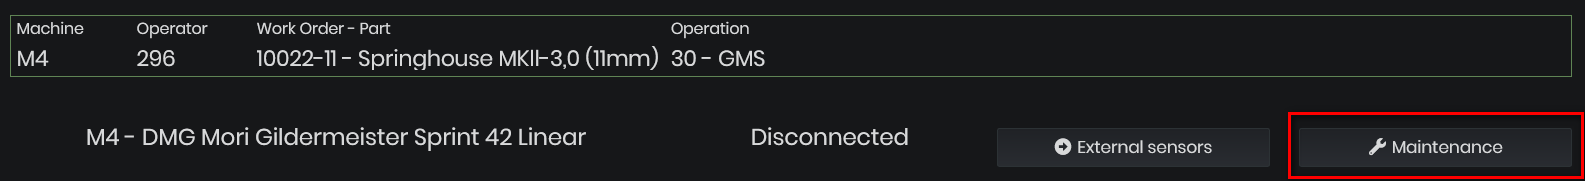
Figure 24:Machine Details - Create a maintenance request
- The form for submitting a maintenance request opens.
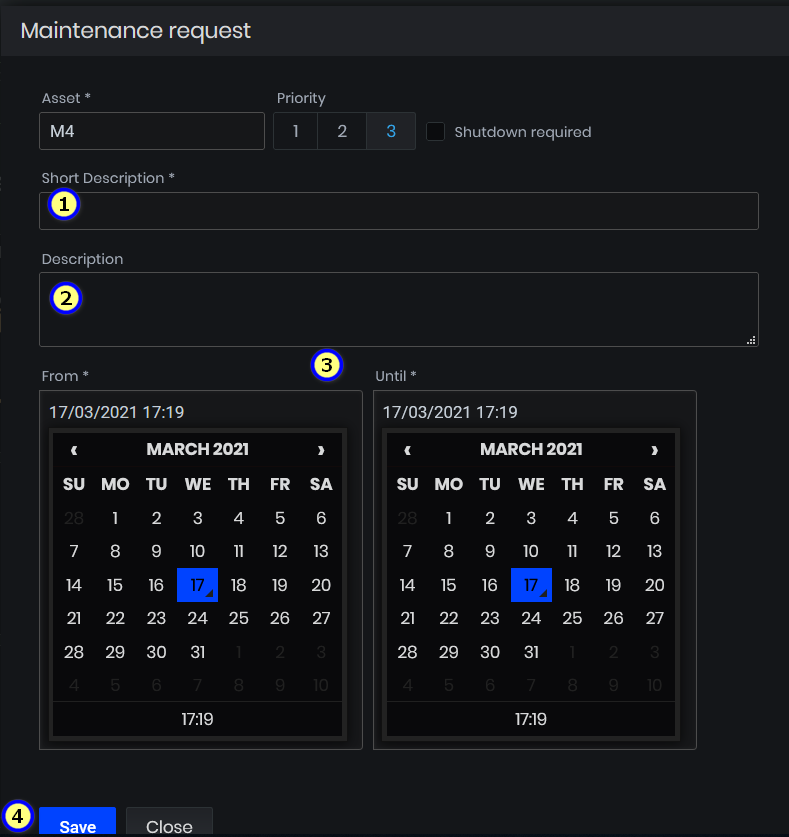
Figure 25: Machine Details - Create a maintenance request for a machine
Fill in details for Priority, and Description, check if Shutdown required. It is possible to attach images to the request. Click the Send button.
-
A maintenance request is being created.
-
View external sensors connected to the machine
When there are machine tags connected to external sensors, the External sensors button is displayed with the number of sensors.
Click the button External sensors opens the External sensors dashboard.

Figure 26: Machine Details - open External sensors dashboard
- Machine Status chart (related to the selected time period)

Figure 27: Machine Details dashboard - machine status timeline
- Machine Downtime chart (related to selected time interval)
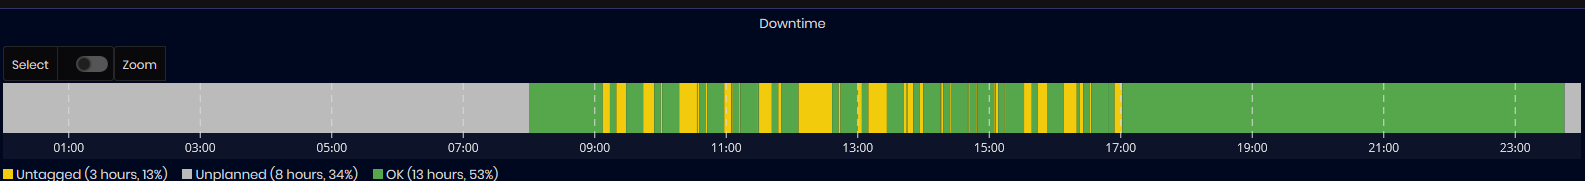
Figure 28: Machine Details dashboard - Downtime chart
-
Specific charts related to the machine type are visualized, such as Axis/Spindle Overrides, Axis/Spindle Rotary Velocity, Axis/Spindle Load, Cycle/Cut Time, etc.
-
Planned maintenance orders for the next 30 days are visualized, if they exist.
-
Reports- machine related reports.

Figure 29: Machine Details dashboard - Reports
Tool report – chart with tools used during the selected time period.
Status report – chart with status information for the selected time period
Program pie chart report
- Status summary (for the last 2 weeks)
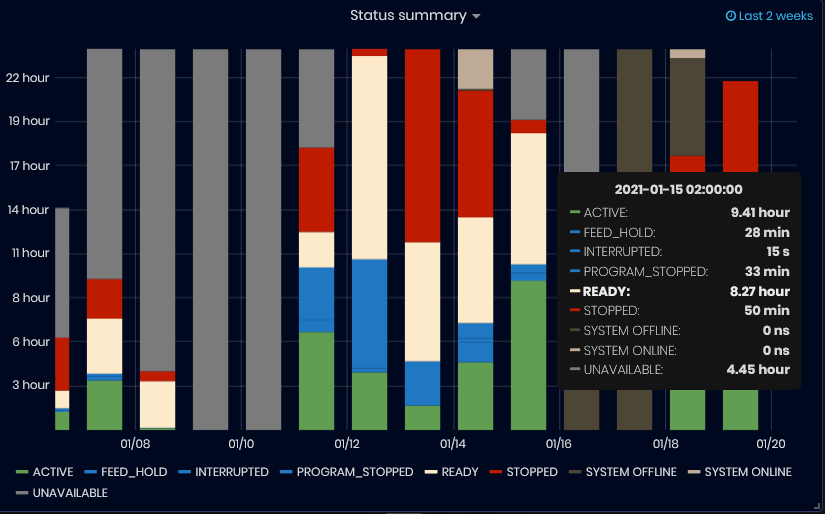
Figure 30: Machine Status summary
The Status summary chart shows machine statuses for the last two weeks, grouped by days. The tooltip for each day shows the duration of each status.
- Downtime summary (for the last 2 weeks)
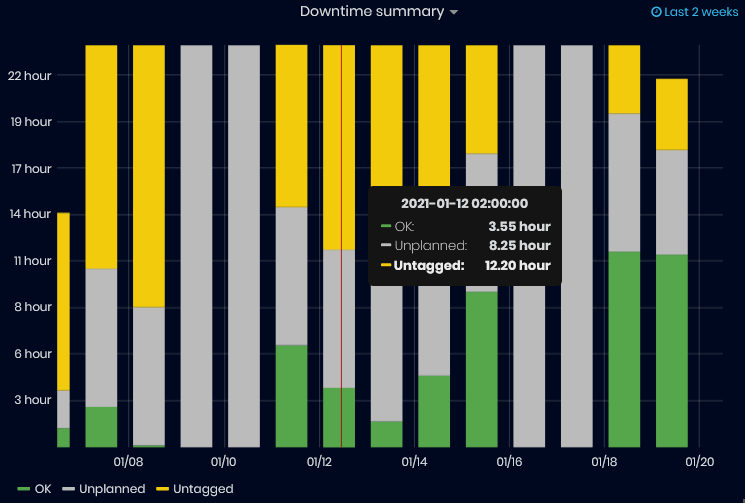
Figure 31: Machine Downtime Summary
The Downtime summary chart shows machine downtime statuses for the last two weeks, grouped by days. The tooltip for each day shows the duration of each status.
Predictive Maintenance & Machine Learning
On the machine details dashboard, expand the Predictive maintenance panel.
- Error Class and Remaining Useful Life charts are shown.
The charts visualize the general state of degradation of a machine, in order to track over time. The ML models as Multiclass Classification and Regression models are used.
For Multiclass classification possible classes are:
- 3 – failure predicted within 2 hours
- 2 – failure predicted within 24 hours
- 1 – failure predicted within 168 hours
- 0 – no failure expected soon
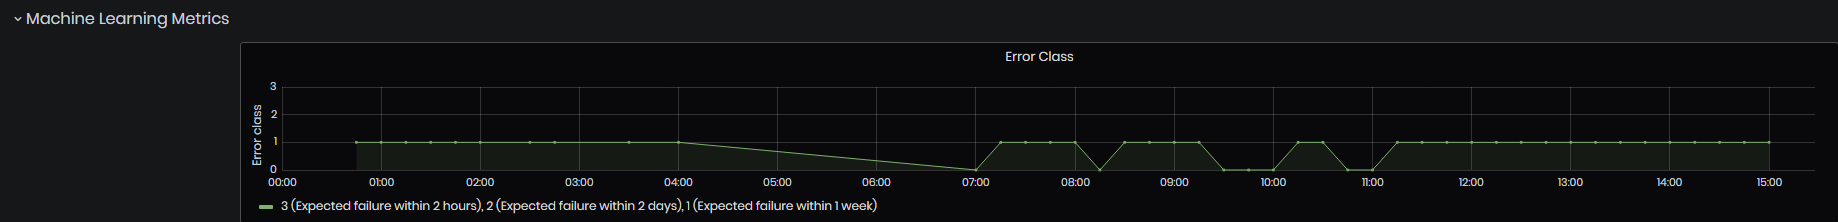
Figure 32: Machine Details dashboard - Error class
For regression models, the values are usually in the interval 0 to 10 weeks and they describe the time interval in which to expect the failure. Min, max, and average values are calculated.
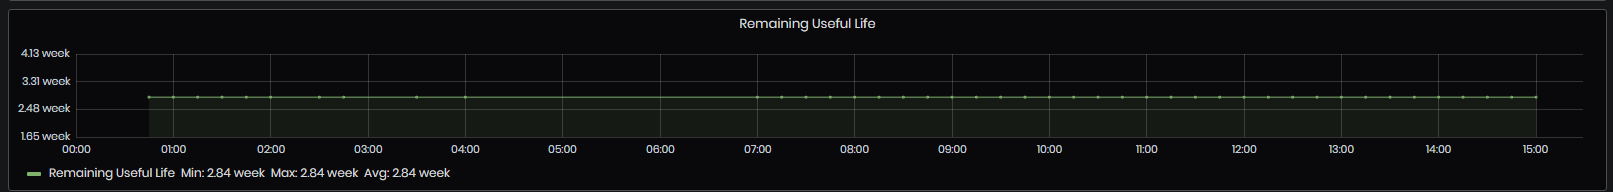
Figure 33: Machine Details dashboard - Remaining Useful Life
Predictive maintenance (PM) models are used for tracking the CNC machines with sensors. Charts with data for temperatures and vibrations for spindles, cooling pumps, conveyors are used for PM.
Factory OEE
To open the Factory OEE dashboard select:
- Machines Summary dashboard, top left link in Factory OEE penel.
- Manager/Factory OEE
- The Factory OEE dashboard opens.
Purpose: Factory OEE dashboard shows average machines OEE for the selected time period. Machine OEE is calculated hourly.
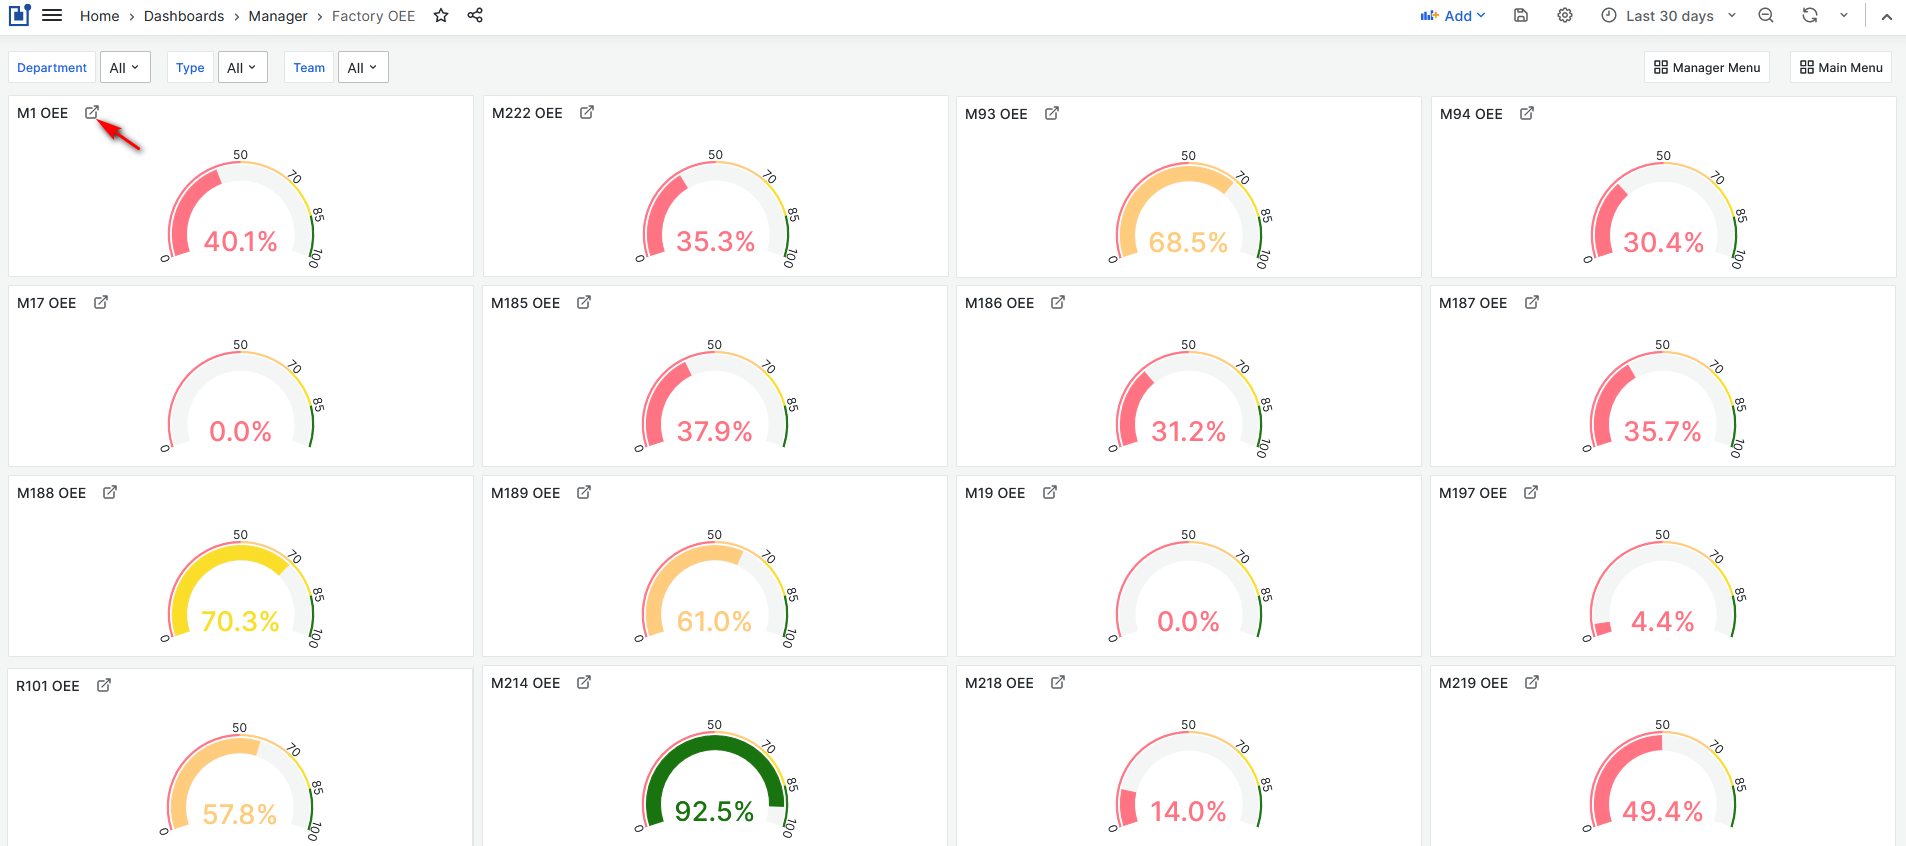
Figure 34: Factory OEE dashboard
From the Factory OEE dashboard users can:
- View each machine's OEE for the selected time period.
- Filter machines by departments, machine type, or team.
- Easily to open machine OEE details dashboard.
Filtering machines in the Factory OEE is possible by:
- Department
- Machine Type
- Team
For the selected machine is possible to open the Machine OEE dashboard
Machine OEE
To open the Machine OEE dashboard select:
- Team Leader/Machines, select some machine, open machine's OEE dashboard.
- Team Leader/Machines, Factory OEE panel/click the top left link, click on the top left link for some machine.
- The Machine OEE dashboard opens.
Purpose: Machine OEE dashboard shows percentages of Machine Utilization, Machine OEE, Availability, Performance, and Quality for the selected time interval. Machine parameters are calculated per day.
Machine OEE = A*P*Q
From the Machine OEE dashboard users can:
- View the average percentage of machine utilization and detailed chart graphic for the selected time period.
- View the average percentage of machine OEE and detailed chart graphic for the selected time period.
- View the average percentages and detailed chart graphics for machine Quality, Performance, Availability for the selected time period.
- Make analysis on the machine OEE parameters (performance, availability, and quality) for a different time periods.
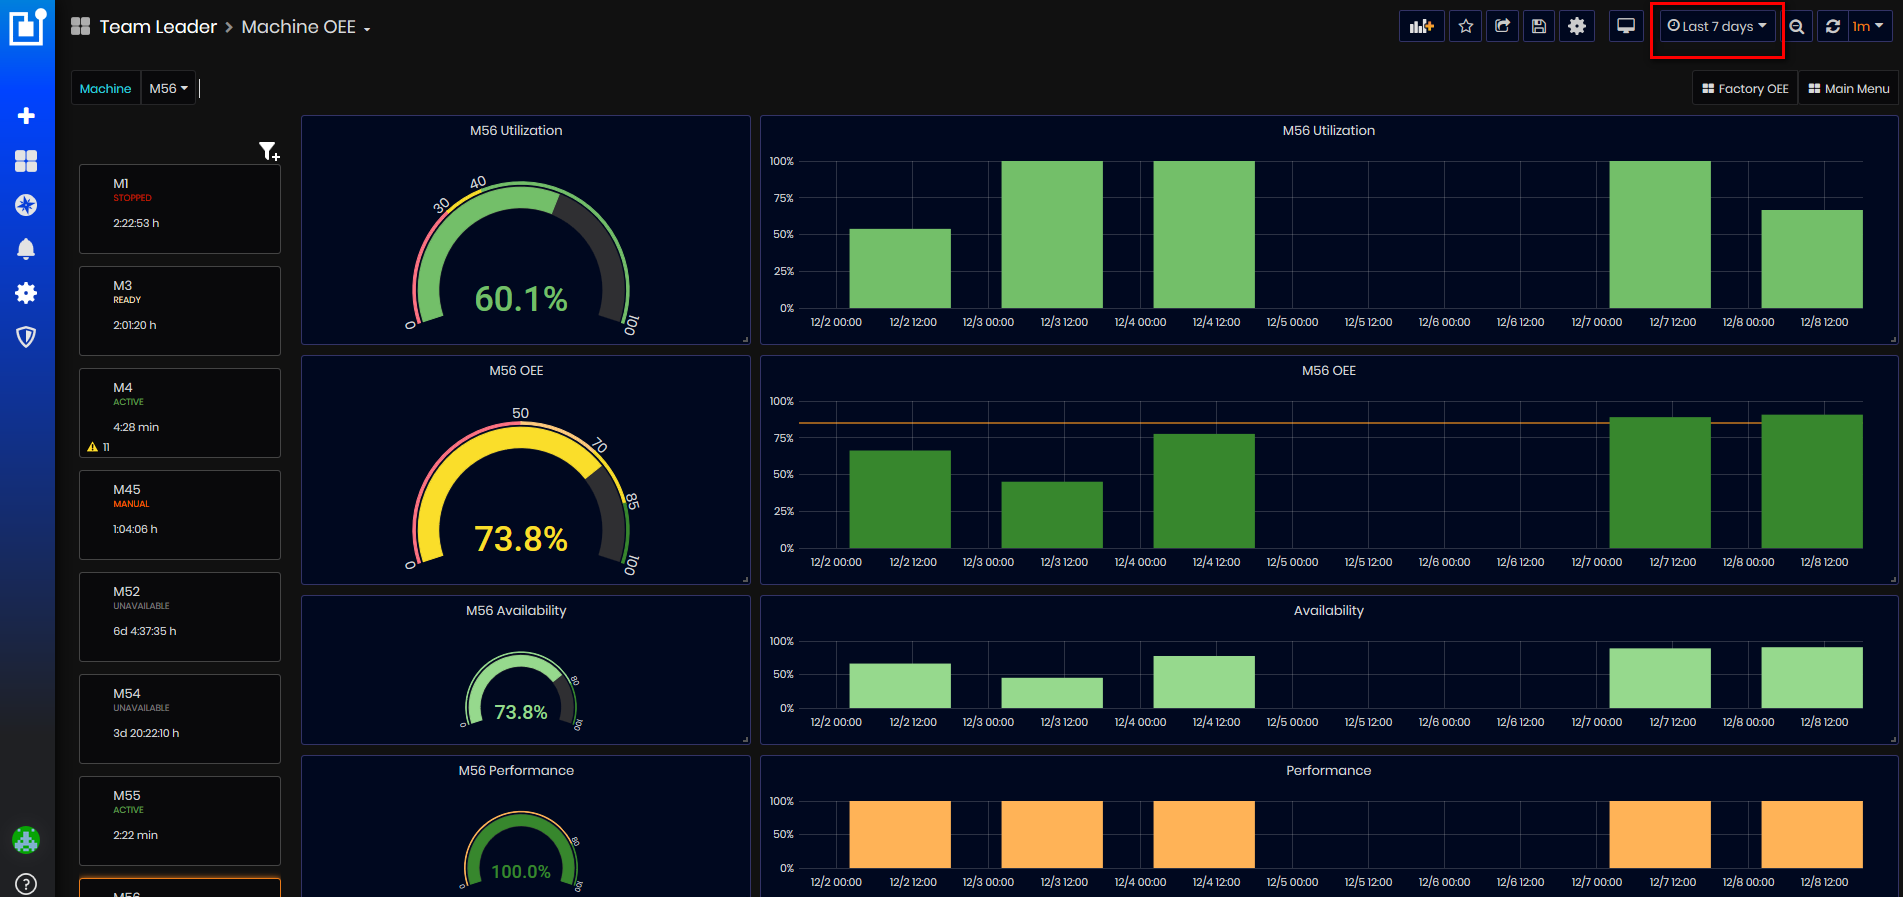
Figure 35: Machine OEE dashboard
On the dashboard are shown the following KPIs for machine:
- Machine OEE (%)
- Machine Availability (%)
- Machine Performance (%)
- Machine Quality (%)
- Machine Utilization (%)
Machine OEE
Overall Equipment Effectiveness (OEE) is the gold standard for measuring manufacturing productivity. It identifies the percentage of manufacturing time that is truly productive. An OEE score of 100% means the manufacturer produces only Good Parts (100% Quality), as fast as possible (100% Performance), with no Stop Time (100%).

Figure 36: Calculation of OEE
Machine OEE is considered the single best metric for identifying losses, benchmarking progress, and improving the productivity of manufacturing equipment.
All calculations below will assume the following structure is in place that determines the way work is planned and reported in the manufacturing domain:
Machine Availability
Availability takes into account all events that stop planned production long enough where it makes sense to track a downtime reason. Availability is calculated as the ratio of Run Time to Planned Production Time. Availability is calculated on a daily basis (or the day until now for days that have not complete).
Planned Production Time (PPT)
For each individual machine, its planned production time is derived from the shift calendar, assigned to the machine in the administration portal. Planned production time could be defined as flexible with up to 4 shifts per day and up to 3 breaks during a shift. A calendar has individual settings for each day of the week, it is selected on machine level and could be configured to start on a specific date.
Note: It is not required that every machine has an assigned calendar. If one does not then the assumption is that it is planned to work 24/7.
Run Time is equal to Planned production time PPT, excluding Stop Time (Downtime).
Calculation steps
- For machine
- For each planned production time interval (shift end-start, excluding breaks), calculate the total planned production time length (PPT)
- Calculate the sum of all downtime for the period (Downtime matches to the periods displayed with status Untagged)
Machine Availability = (PPT- Downtime) / PPT * 100 (%)
Note: Availability is always in the range [0%; 100%] as all of the components are positive and downtime could not exceed planned production time.
Machine Performance
Performance calculation takes into account everything that causes the manufacturing process to run suboptimally when it is running. Then performance is calculated as the ratio between the ideal running time overall cycles and the operations running time.
Note: Performance is always in the range [0%; 100%]. In case performance is calculated to above 100%, then the ideal planned time shall be readjusted.
Ideal Running Time (Ideal Cycle Time) is subject to planning and shall be the fastest cycle time that the process could achieve under optimal circumstances. Ideal running time could be available per operation level.
IdealCycleTime = TimePerItem(from ERP)
Calculation steps
-
For each machine and selected time period
- For each operation
OperationTimeTotal += OperationLog[i].EndDate - OperationLog[i].StartDate
OperationIdealTimeTotal = setupTime + (timePerItem * producedQuantity)
IdealTimeTotal += Operation[i].OperationIdealTimeTotal
Machine Performance = (IdealTimeTotal / OperationTimeTotal) * 100;
Note: The performance calculation algorithm with the utilization of cycle time on machine compared against planned time would be much more precise. Then for each operation execution, the KPI will sum up the ideal time vs the actual time, based on the NC cycle duration.
Machine Quality
Quality takes into account manufactured parts that do not meet quality standards, including parts that need rework. Quality takes into account the first pass through the manufacturing process.
Good Parts are parts that have passed quality control inspection.
- For each machine
- For each operation
-
Iterate through time tracking reports and sum up logs for good quantity
GoodPartsTotal += OperationLog[i].GoodParts
-
Scrap Parts (Bad Parts) are parts that have not passed quality control inspection.
- For each machine
- For each operation
-
Iterate through time tracking reports and sum up logs for scrap quantity
ScrapPartsTotal += OperationLog[i].ScrapParts
-
Calculation Steps
-
For each machine
-
For each operation
- MinGoodPartsTotal – the minimum of good parts across all operation
- SumScrapPartsTotal – the sum of scrap parts across all operations
Machine Quality = (MinGoodPartsTotal) / (MinGoodPartsTotal + SumScrapPartsTotal) *100
Status
To open the Status dashboard select:
- Team Leader/Status
- The Status dashboard opens.
Purpose: Dashboard shows detailed machine statuses information during the selected time period, for all machines in the enterprise.
Users can get the following information from this dashboard for the selected time period:
- Information on the statuses of all machines in the enterprise.
- For each machine - the current status and the duration of time with this status.
- The machine statuses over time.
- Each status has a different color, duration in hours and % of working time.
- Summary in hours for all statuses.
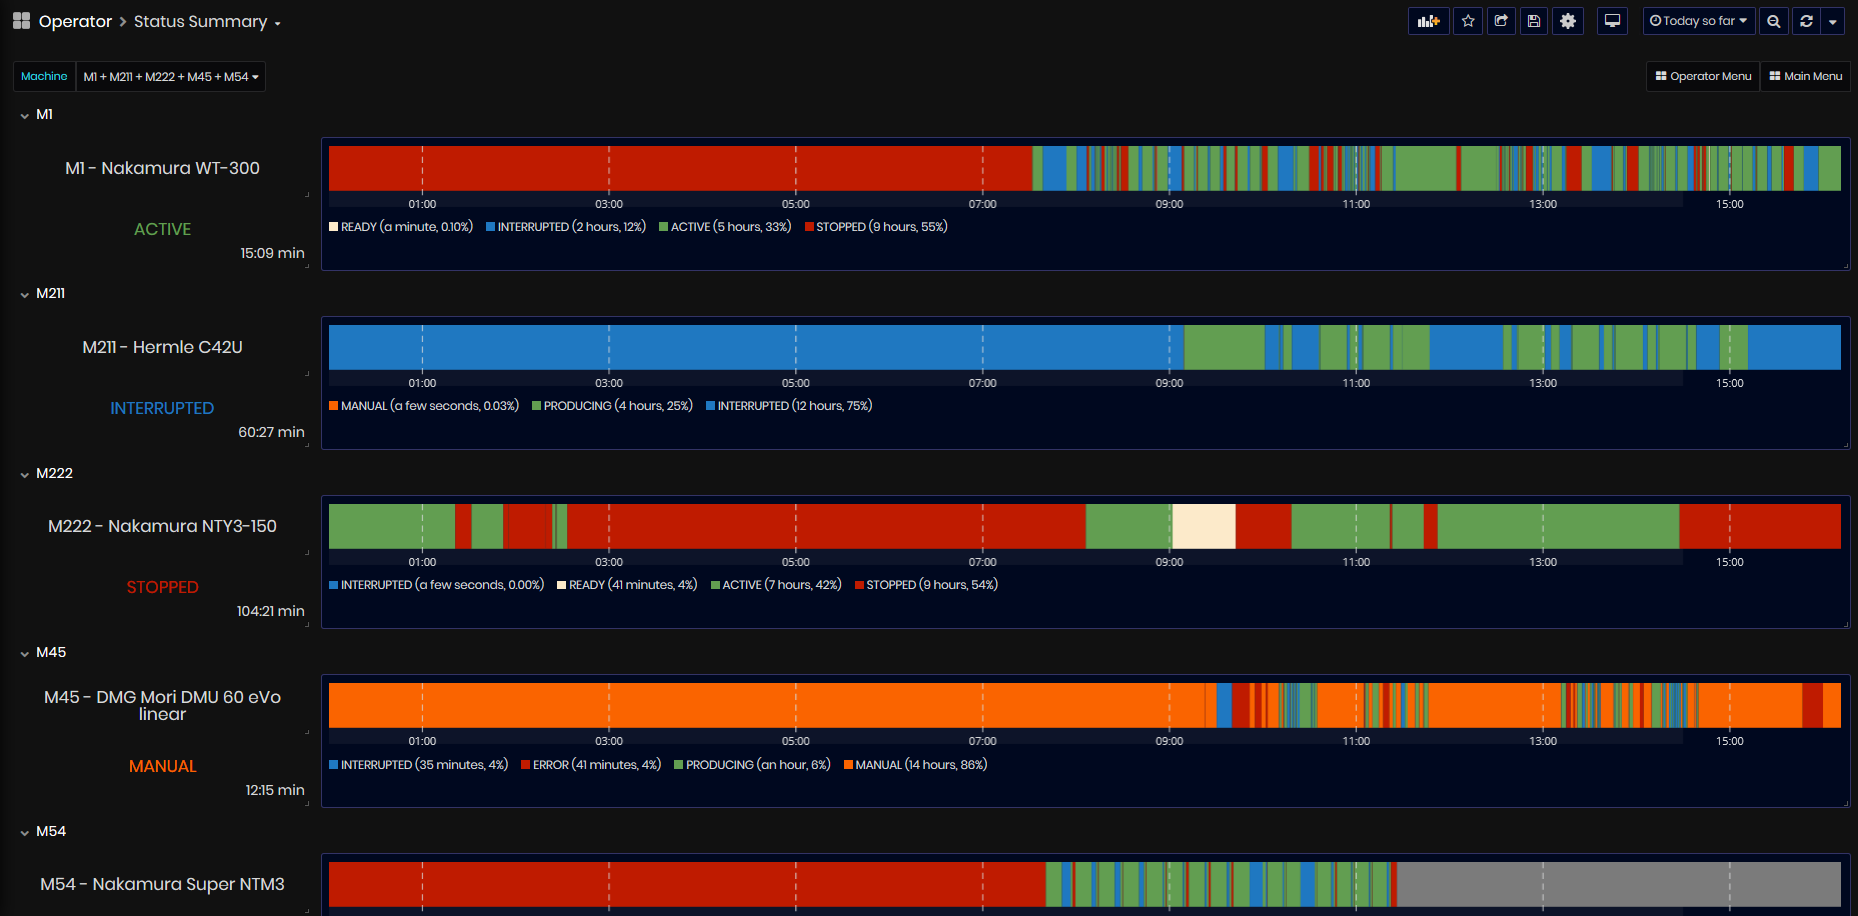
Figure 36: Status dashboard
- For each machine is displayed Machine name, machine status, and duration of time.
Machine list can be filtered by machine(s) or Team.
The time period can be selected from the list of relative periods or set as an absolute period.
Alarms
To open the Alarms dashboard select:
- Team Leader/Alarms:
- The Alarms dashboard opens.
From the Alarms dashboard, user can see:
- Current active alarms from all machines.
- Can filter only by one machine clicking the machine number link.
- All messages for the current time period as list and pie chart.
- All system warnings.
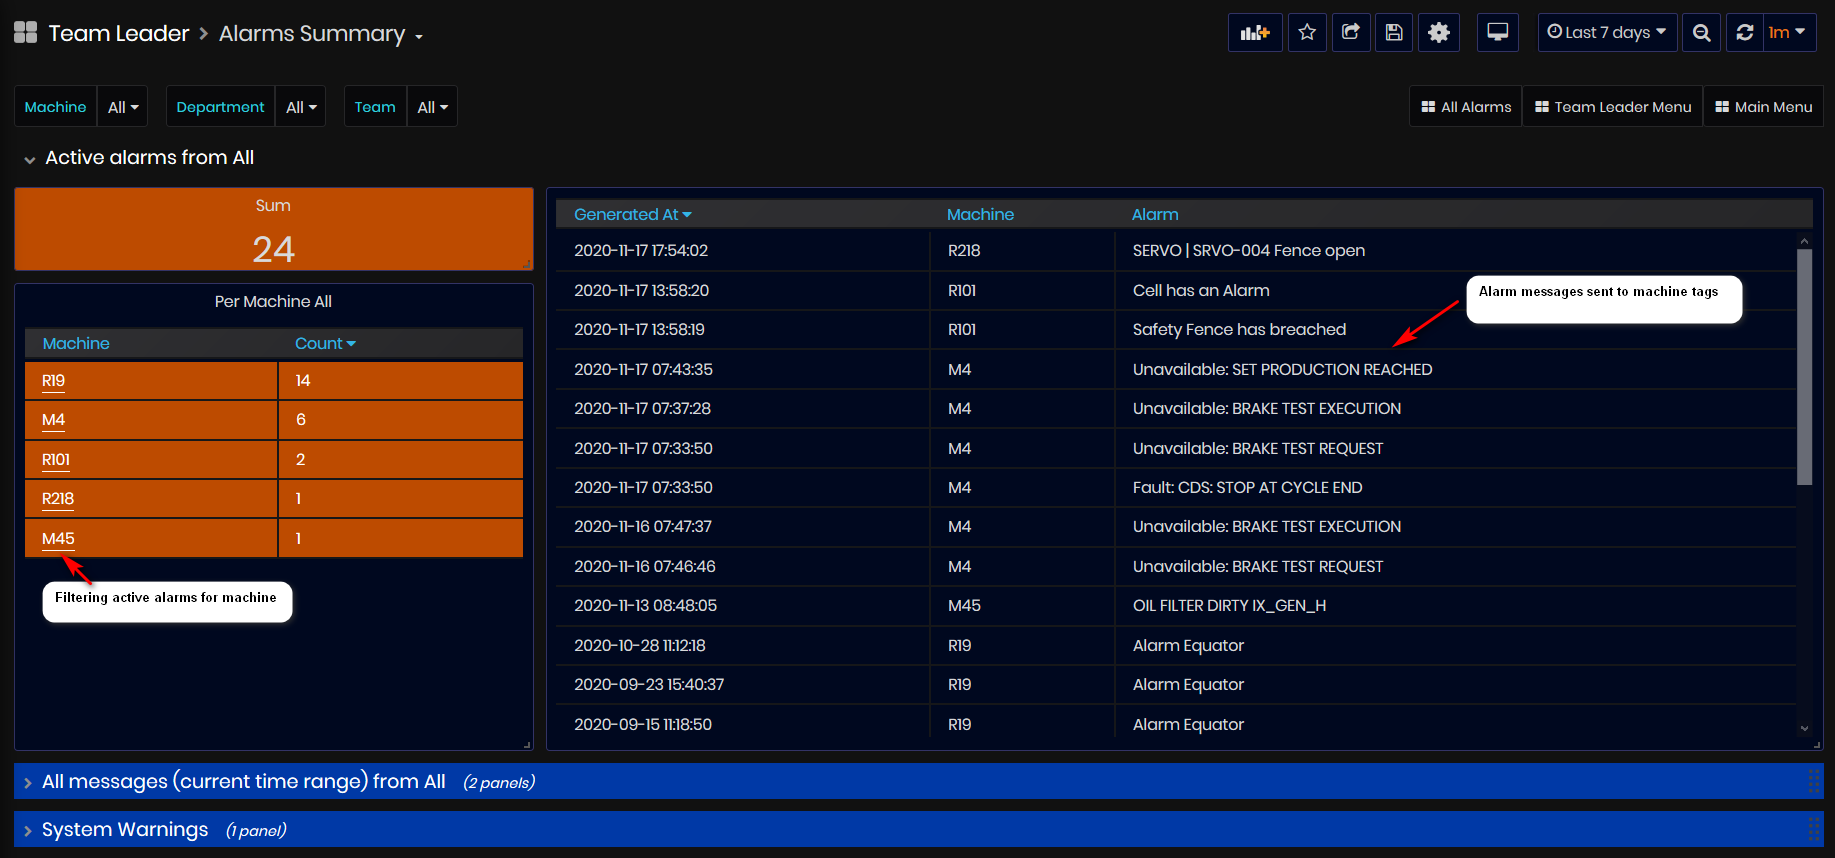
Figure 37: Alarms Summary dashboard - Active alarms
In the section, Active alarms from All machines are shown:
- All active alarms messages sent to machine tags.
Messages for one machine can be filtered by clicking the machine number link or by machine filter.
In the section All Messages (current time range) from All are shown all alarm messages sent for the selected time period.
All messages are shown also by pie chart.
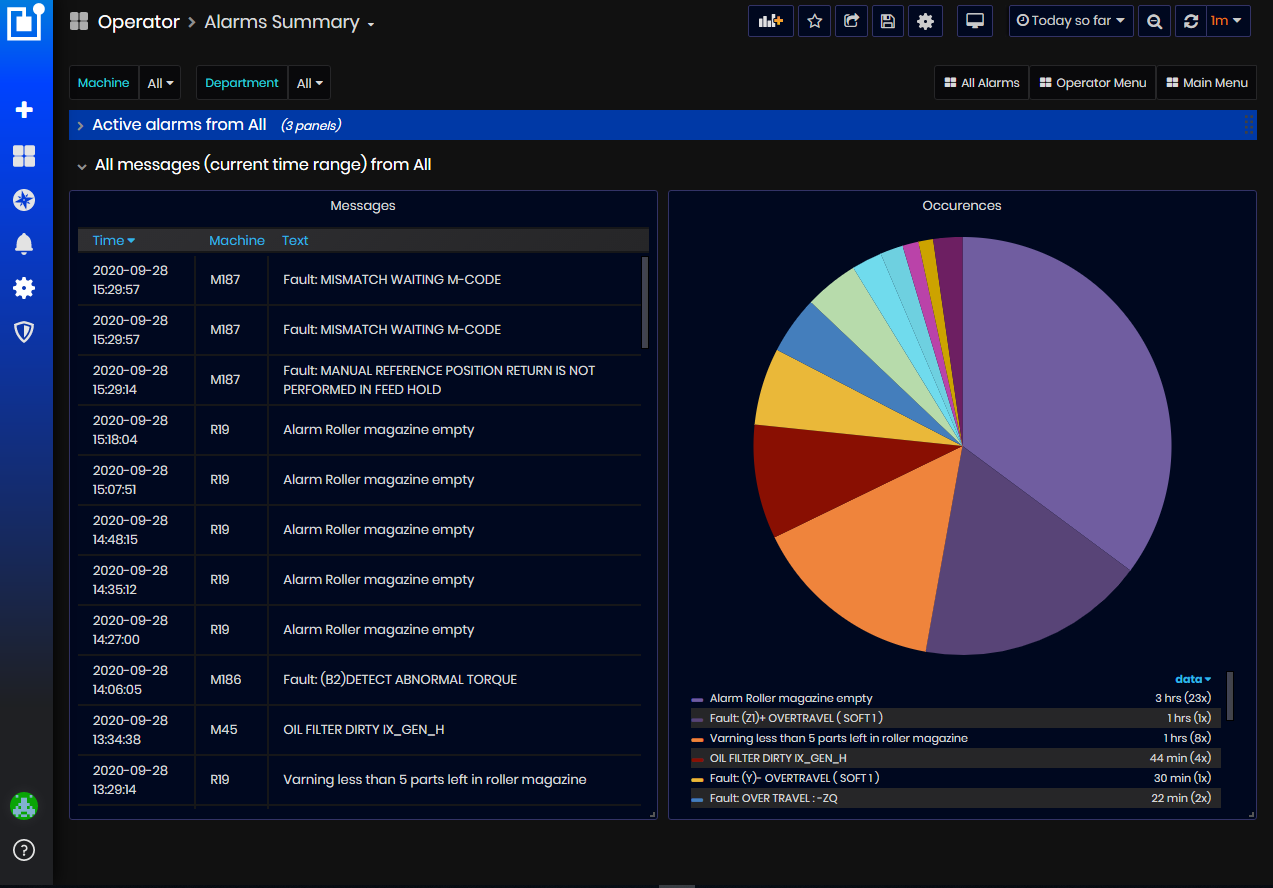
Figure 38: Alarms Summary dashboard - All messages
In the System Warnings section, active system warnings can be visualized, defined in the Upkip Administration by warnings and triggered by events with severity: Alarm, Warning or Information.
Maintenance
To open the Maintenance dashboard select:
- Team Leader/Maintenance:
- The Maintenance dashboard opens.
Purpose: The Maintenance dashboard displays summary information about maintenance orders for machines and checkpoints imported from the Maintenance Management system (MMS).
From this dashboard, users can see:
- Total checkpoints due today expired maintenance orders and orders expiring this week.
- Scheduled checkpoints for various machines for today, their frequency. (Point due today)
- For each machine – summary list of maintenance work orders with their numbers, dates from-to, priority, status, description, responsible from the MMS system.
- URL for opening work order in the MMS for detailed information.
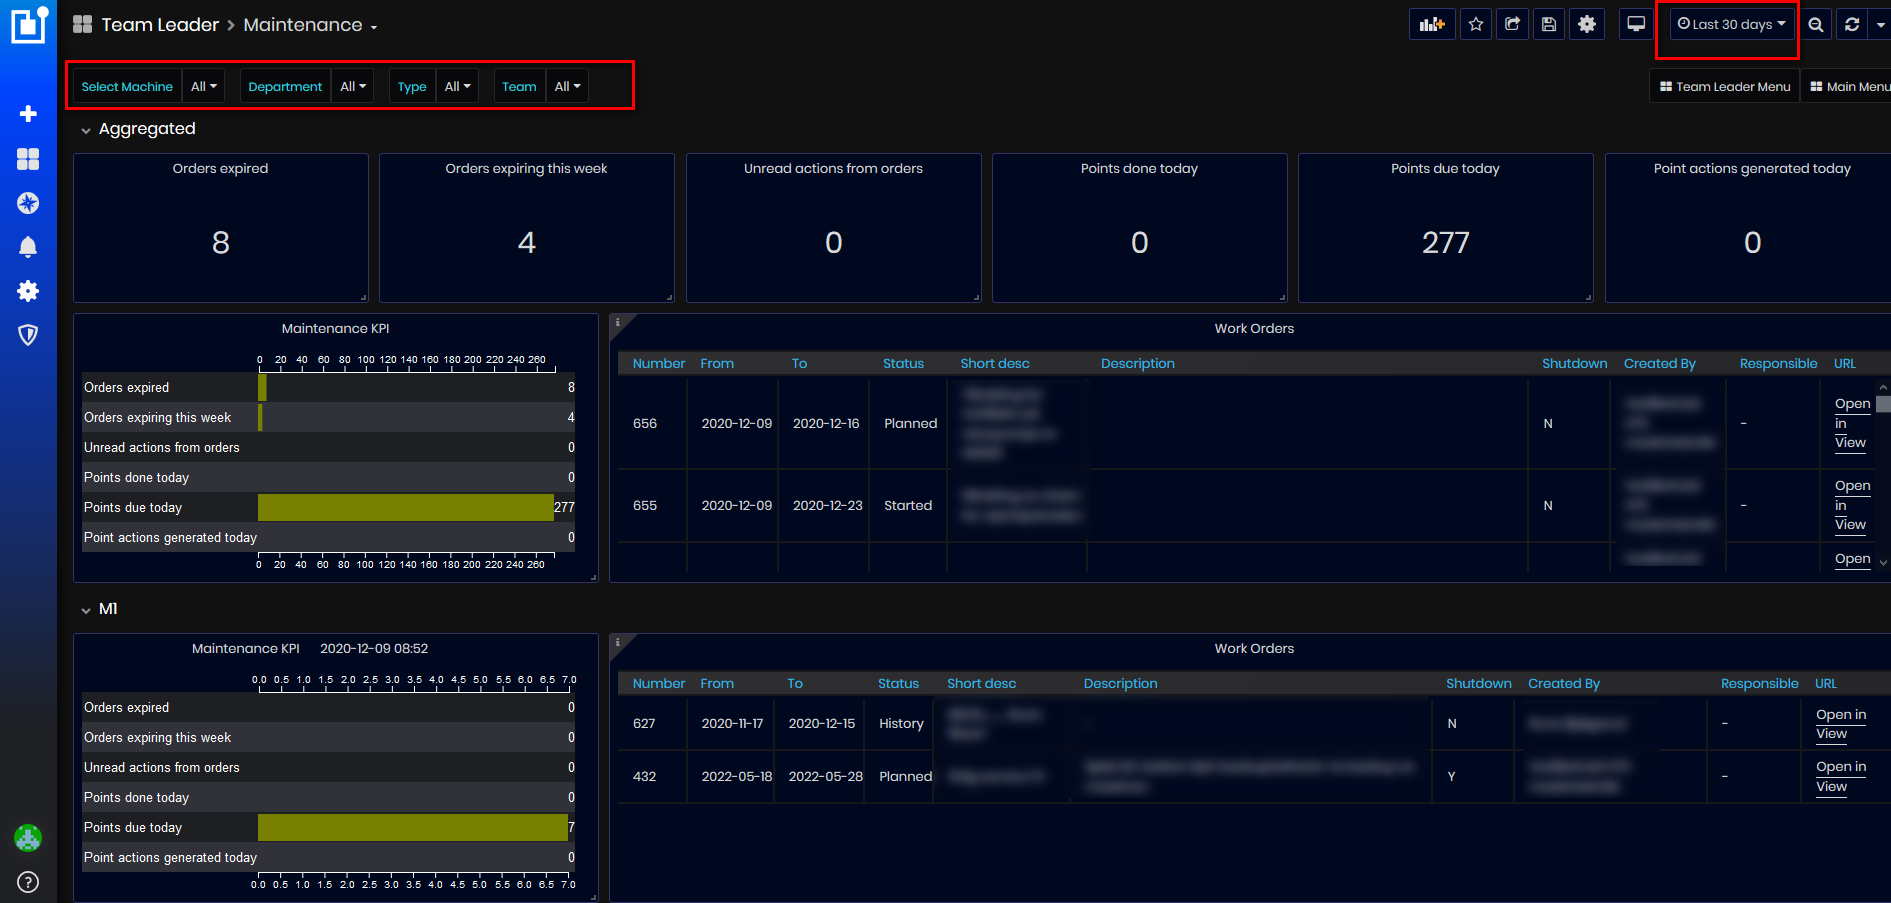
Figure 39: Maintenance dashboard
The Maintenance dashboard shows aggregated maintenance information for selected machines by filters(or all) and panel for each machine with maintenance orders and checkpoints. Maintenance orders for machines are shown from the start date of the selected time interval (top right) and 1 year ahead.
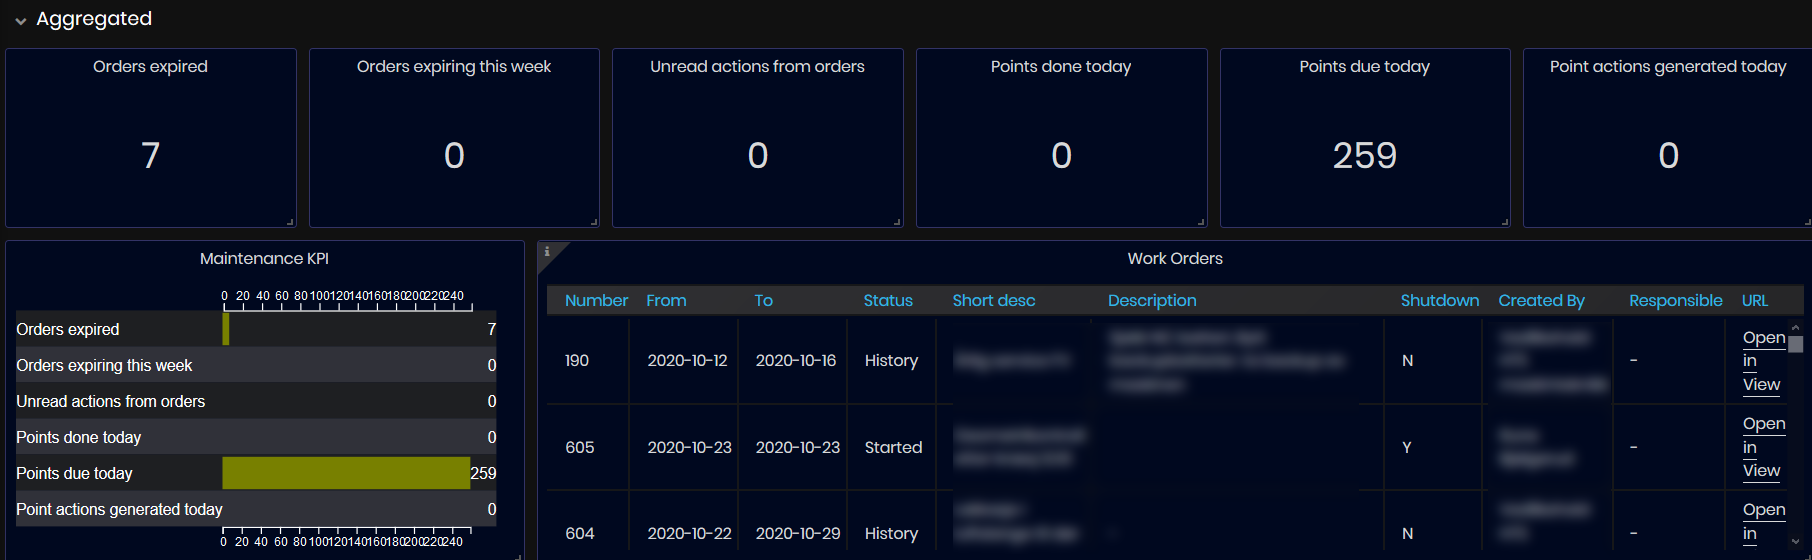
Figure 40: Maintenance dashboard - Aggregated panel
On the top of the dashboard is shown Aggregated information about maintenance work orders for all machines in the enterprise(or filtered machines): Orders expired, Orders expiring this week, Unread actions from orders, Points done today, Points due today, Point actions generated today.
Aggregated panel with maintenance KPI graphic and work orders list for all machines in the enterprise (or filtered machines).
For each machine in the enterprise are shown:
- Maintenance KPI <Date and time> of the last synchronization.
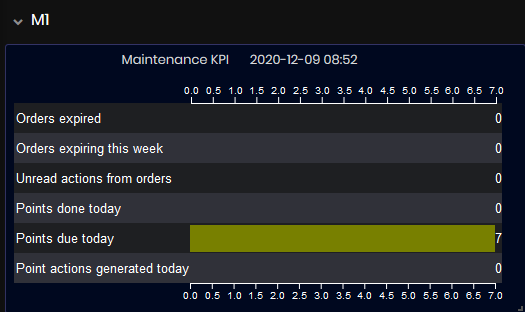
Figure 41: Maintenance dashboard - Machine Maintenance KPIs
- Point due today are shown only as a number checkpoint planed in the Maintenance management system.
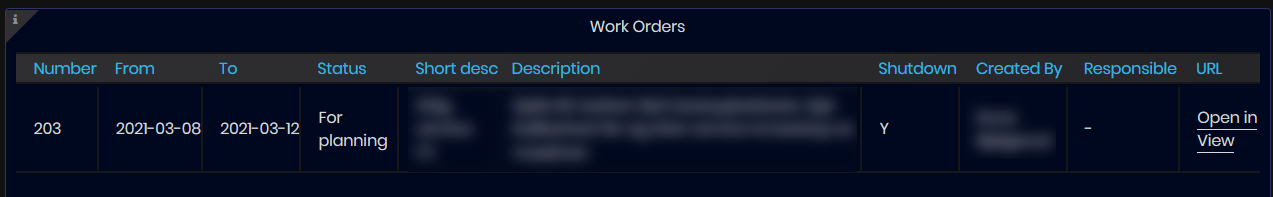
Figure 42: Maintenance dashboard - Maintenance orders for machine
- Machine maintenance work orders list panel
- For each machine, maintenance orders are listed with: work order number, planed period from-to, status, short and long description of the order, shutdown, created by, and responsible person.
- URL Link – link to open the order in the maintenance system for detailed information. Clicking on the URL link the order is opened in the MMS with detailed information.

Figure 43: Maintenance dashboard - Filtering machines
- Filtering Maintenance dashboard.
- By machines. Users can select All – for all machines, or select some machines. It is possible to filter also by entering part of the machine number.
- By Type of machine.
- By Department.
- By Team.
Tool Usage
To open the Tool Usage dashboard select:
- Team Leader/Tool Usage:
- The Tool Usage dashboard opens.
Purpose: The dashboard Tool Usage shows information for all or filtered machines, how many tools have been used, hours, and periods for each tool. The information comes from the machine tags.
Using this dashboard, users can filter and find information about:
- Which machine how many tools are used, duration, and periods of each tool.
- Using tools by department.
- Summary information about using the tools.
- By default, dashboard shows tool usage for the last 30 days.
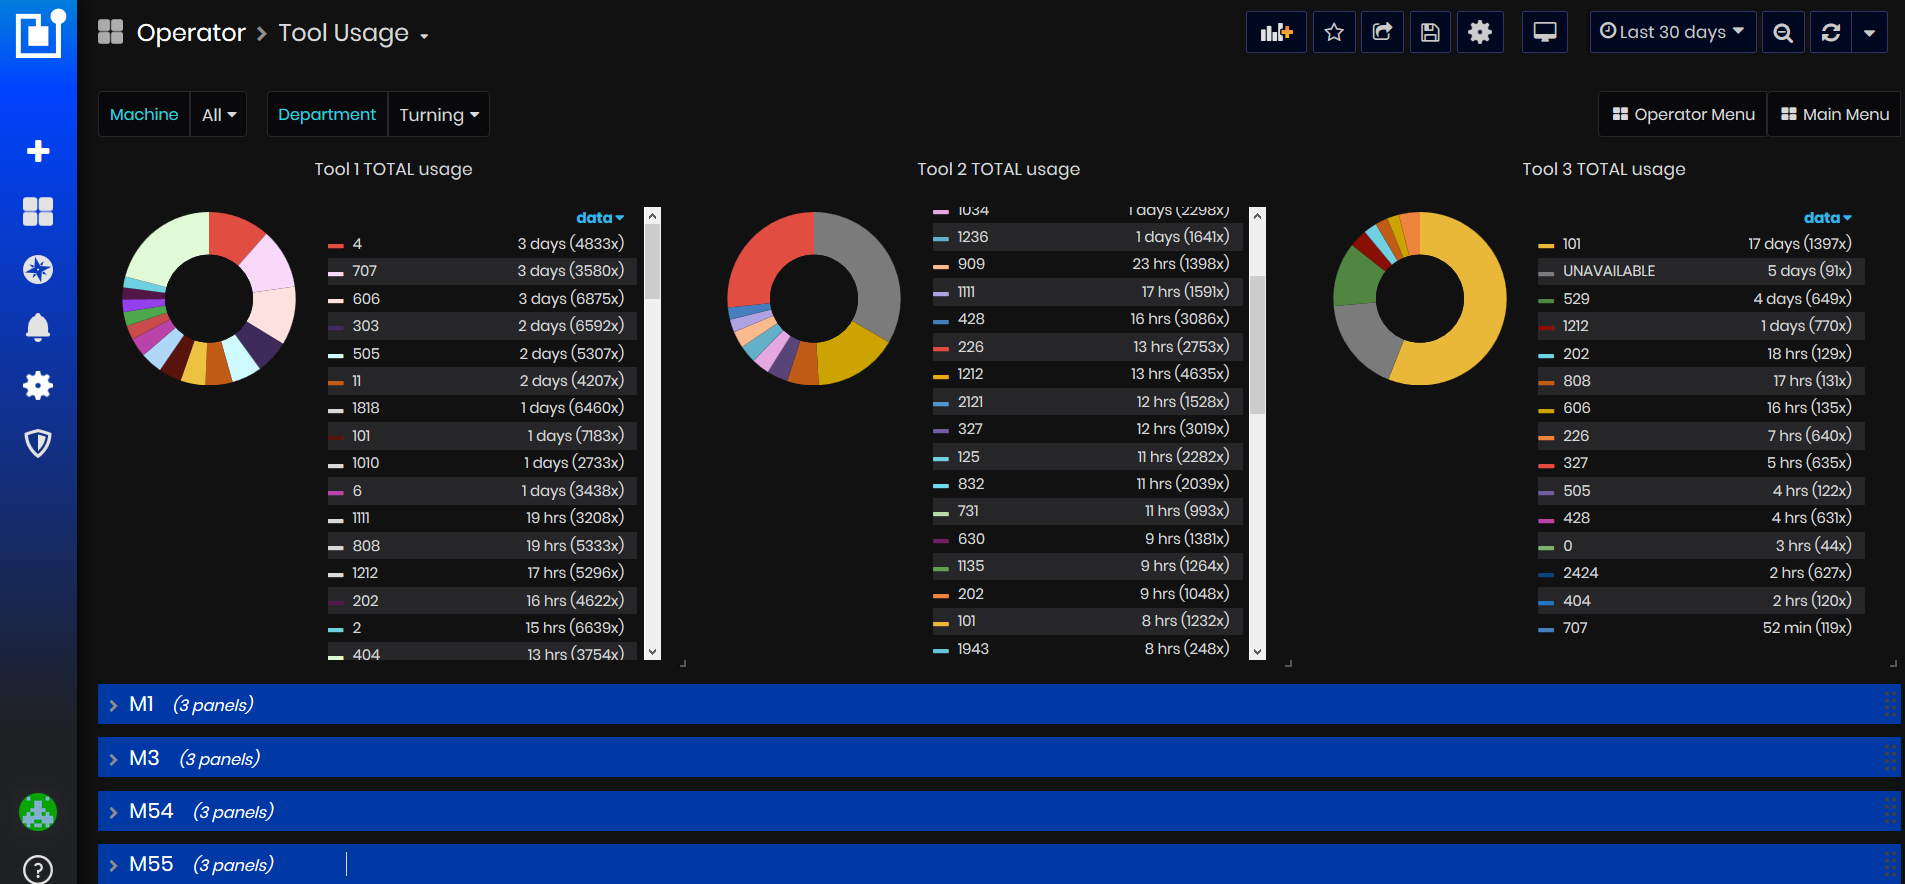
Figure 44: Tool Usage dashboard
Aggregated Tool Total usage is displayed at the top of the dashboard.
For each machine, in a separate panel is displayed information about the number of tool used and the duration of use.
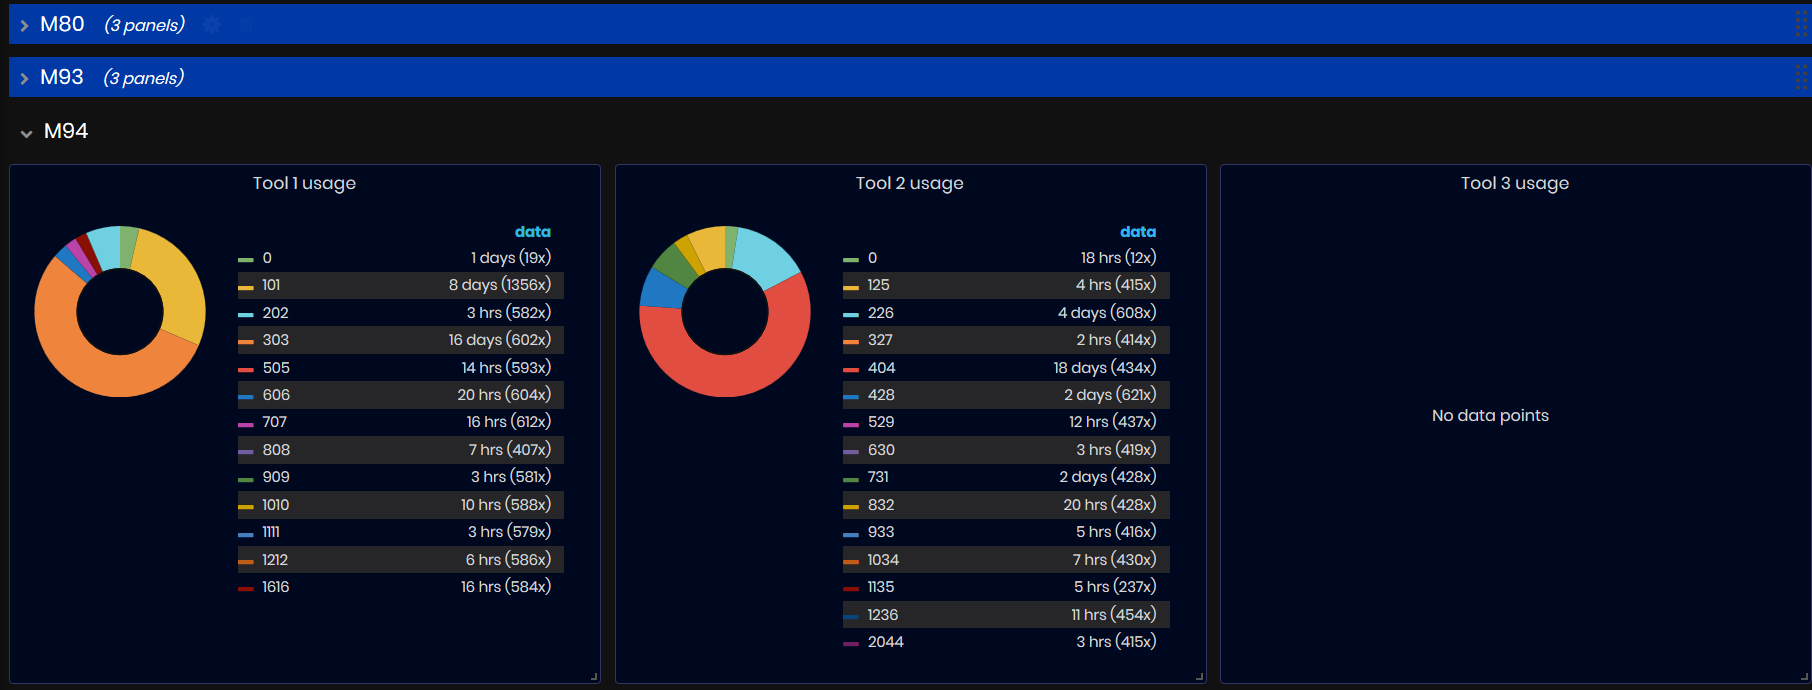
Figure 45: Tool Usage dashboard - Machine panel
The information can be filtered by machine, department, or team.
SPC
To open the SPC (statistical process control) dashboard select:
- Team Leader/SPC
- The SPC Measurements dashboard opens.
Purpose: The SPC dashboards show measurements of various parts of the orders on measuring stations. Upkip periodically checks and imports measurement data from the Q-DAS DB.
There are two types of measurements:
- Normal – represents an actual measured float value that should be between some limits.
- Ordinal - has a binary output GO/NOGO, which indicates operator input on the quality.
SPC Measurements
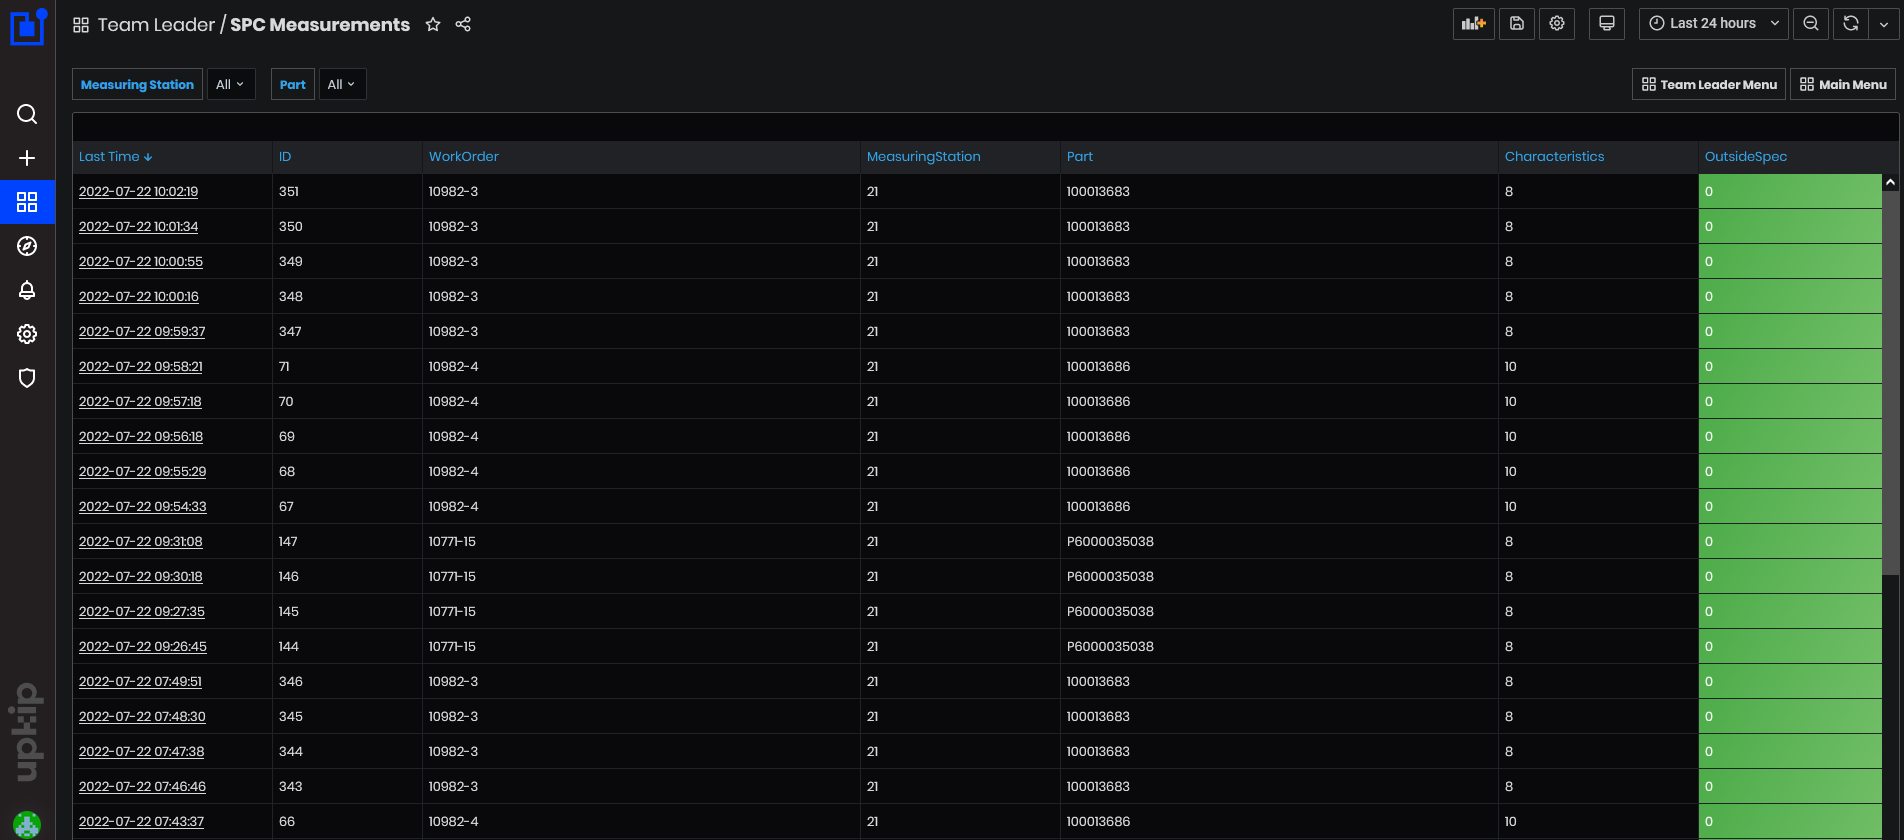
Figure 46: SPC - SPC Measurements
The SPC Measurements dashboard displays data from various part measurements from different measuring stations.
Data can be filtered by measuring station, part number, or work order

Figure 47: SPC - filtering SPC measurements
The data are shown in a table with the following columns**:**
- Last Time – date and time of the executed measurement.
- ID – ID of the measurement.
- WorkOrder - work order number – position number.
- MeasuringStation - number of the measuring station.
- Part - part item code.
- Characteristics - the number of measured characteristics of the part.
- OutsideSpec - colored column with red or green and number of characteristics that are outside of the specifications limits.
Clicking on the link with Last Time opens the dashboard SPC Measurement Values.
SPC Measurement Values
Purpose: SPC Measurement Values dashboard shows measurement values of the part characteristics of the selected measurement by timestamp. One measurement is identified with timestamp, ID, measuring station and part.

Figure 48: SPC - SPC Measurement values of the selected measurement
Dashboard can be filtered by ID, Measuring station and Part code.

Figure 49: SPC - filtering SPC measurement values
Data from the selected measurement are shown in a table with the following columns**:**
- Timestamp – date and time of the measurement of the part characteristic.
- Characteristic - the name of measured characteristic of the part.
- Nominal – the nominal value of the characteristic.
- LowerSpec – the value of lower specification limit.
- UpperSpec – the value of upper specification limit.
- Spec Status - colored column with green and OK or red and Not OK.
In the table is possible to have characteristic Visual inspection with value from operator (OK/NOTOK).
Clicking on the link with Characteristic name opens the dashboard SPC Details.
SPC Details
Purpose: The SPC Details dashboard shows details about measurement of the selected characteristic.
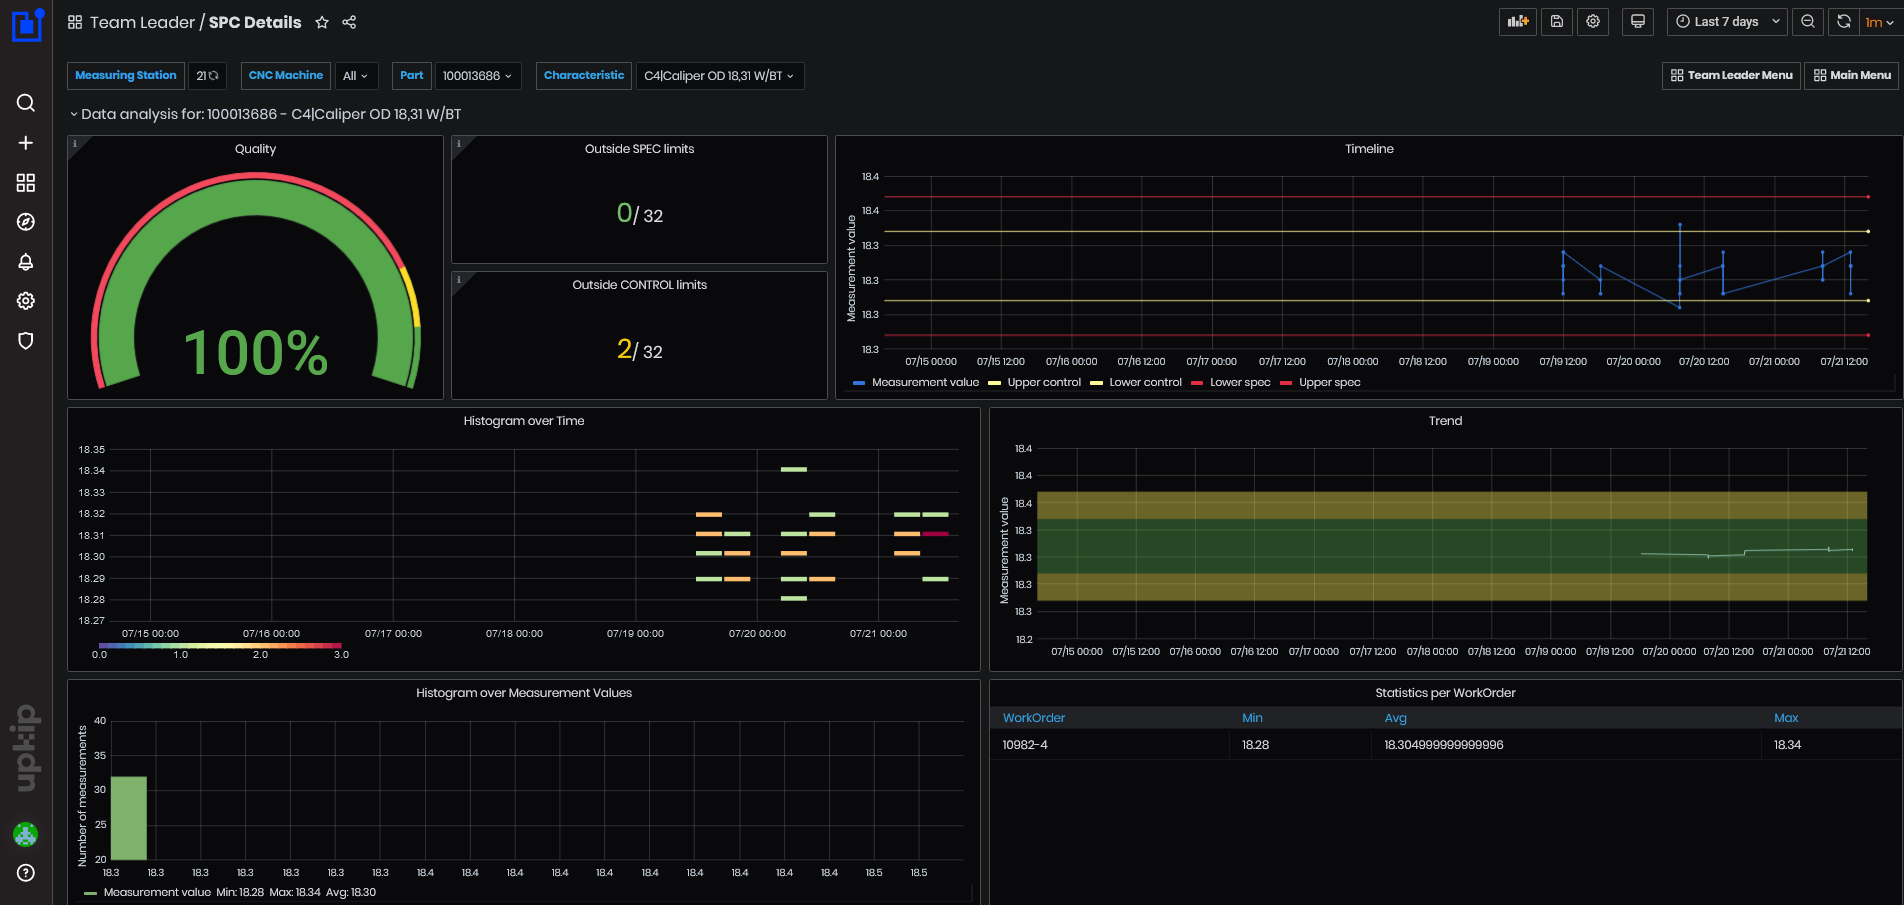
Figure 50: SPC - SPC details
Characteristic details can be filtered by measuring station, CNC machine, part and characteristic.
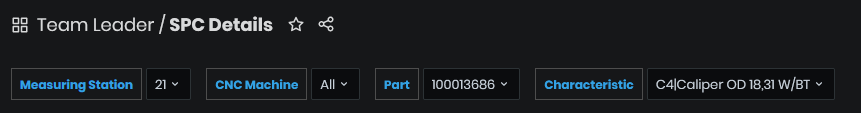
Figure 51: SPC - filtering SPC details
The top panel shows data analysis for part and characteristic.
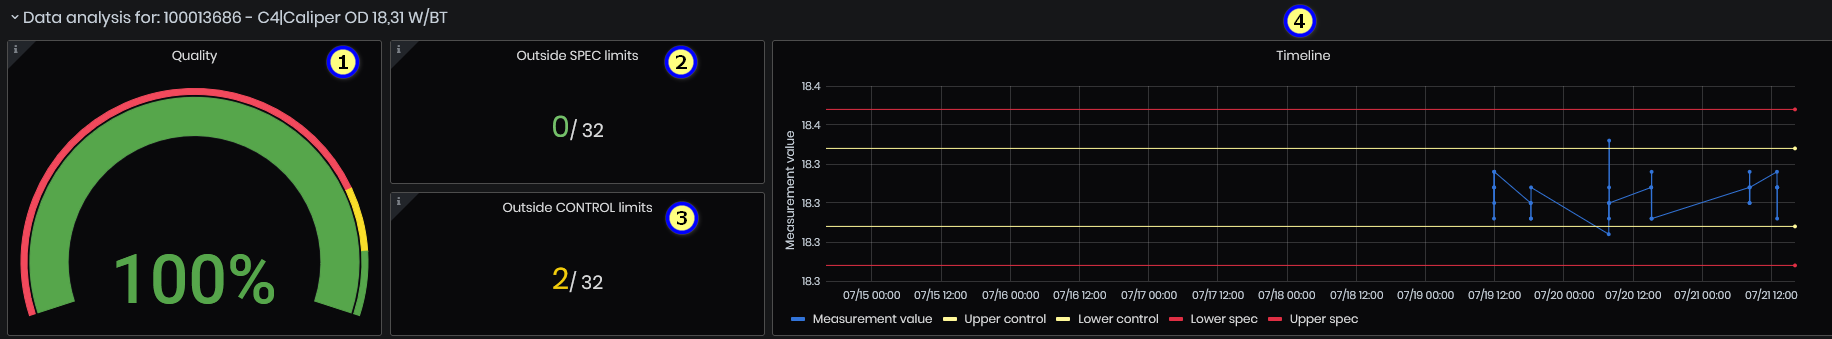
Figure 52: SPC details - quality, outside limits and timeline
- Quality - shows the percentage of values inside specification limits.
- Outside SPEC limits – panel shows the number of characteristics outside the specification limits.
- Outside CONTROL limits - panel shows the number of characteristics outside the control limits.
- Timeline – shows measurement value and previous values (blue color), lower and upper specification limits (red lines), lower and upper control limits (yellow lines).
The next panels:
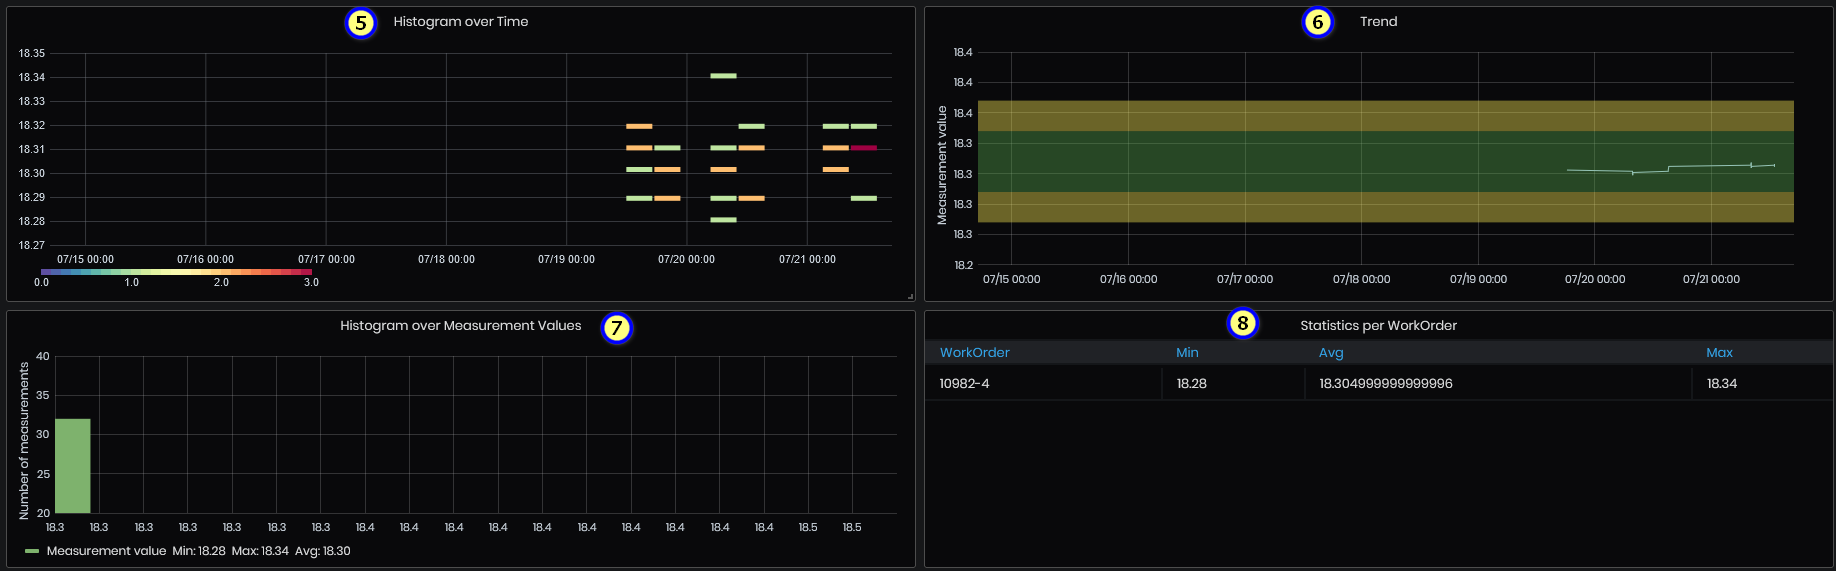
Figure 53: SPC details - data analysis
- Histogram over time
- Trend – measurement values, area of the specification and control limits.
- Histogram over measurement values.
- Statistics per work order – minimum, maximum and average.
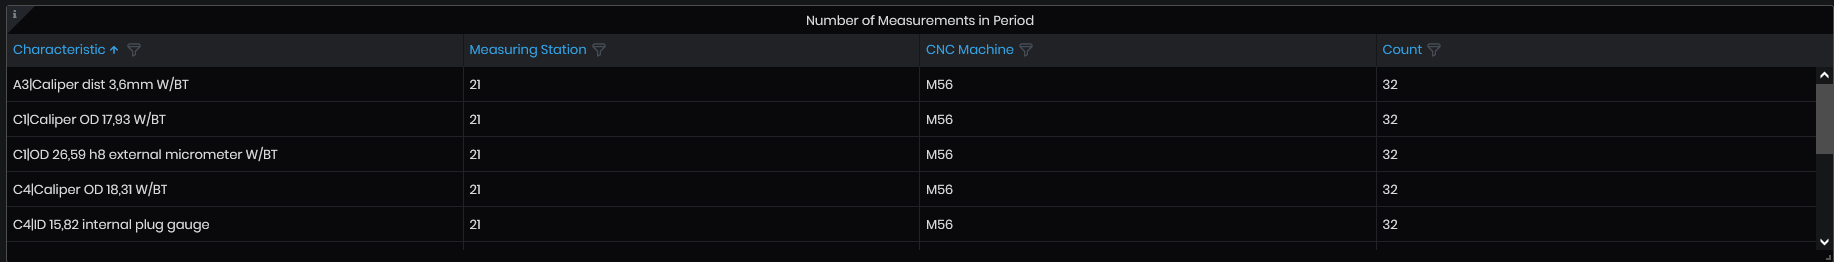
Figure 54: SPC details - the number of measurement in the selected time period
The table shows the number of measurements registered in the selected time period, grouped by Characteristic. The columns are: Characteristic (name), Measuring station (number), CNC machine (machine ID), Count (characteristic measurements count).
CO2 Emissions
To open the CO2 emissions dashboard select:
- Team Leader/CO2 emissions:
- The CO2 emissions dashboard opens.
The dashboard CO2 emissions shows machine power measured by ReMoni power sensors (M222) converted to carbon released per kWh. UK CO2(eq) emissions due to electricity generation 0.23314kg CO2e per kWh.
Calculator to convert power to CO2 - https://www.rensmart.com/Calculators/KWH-to-CO2.
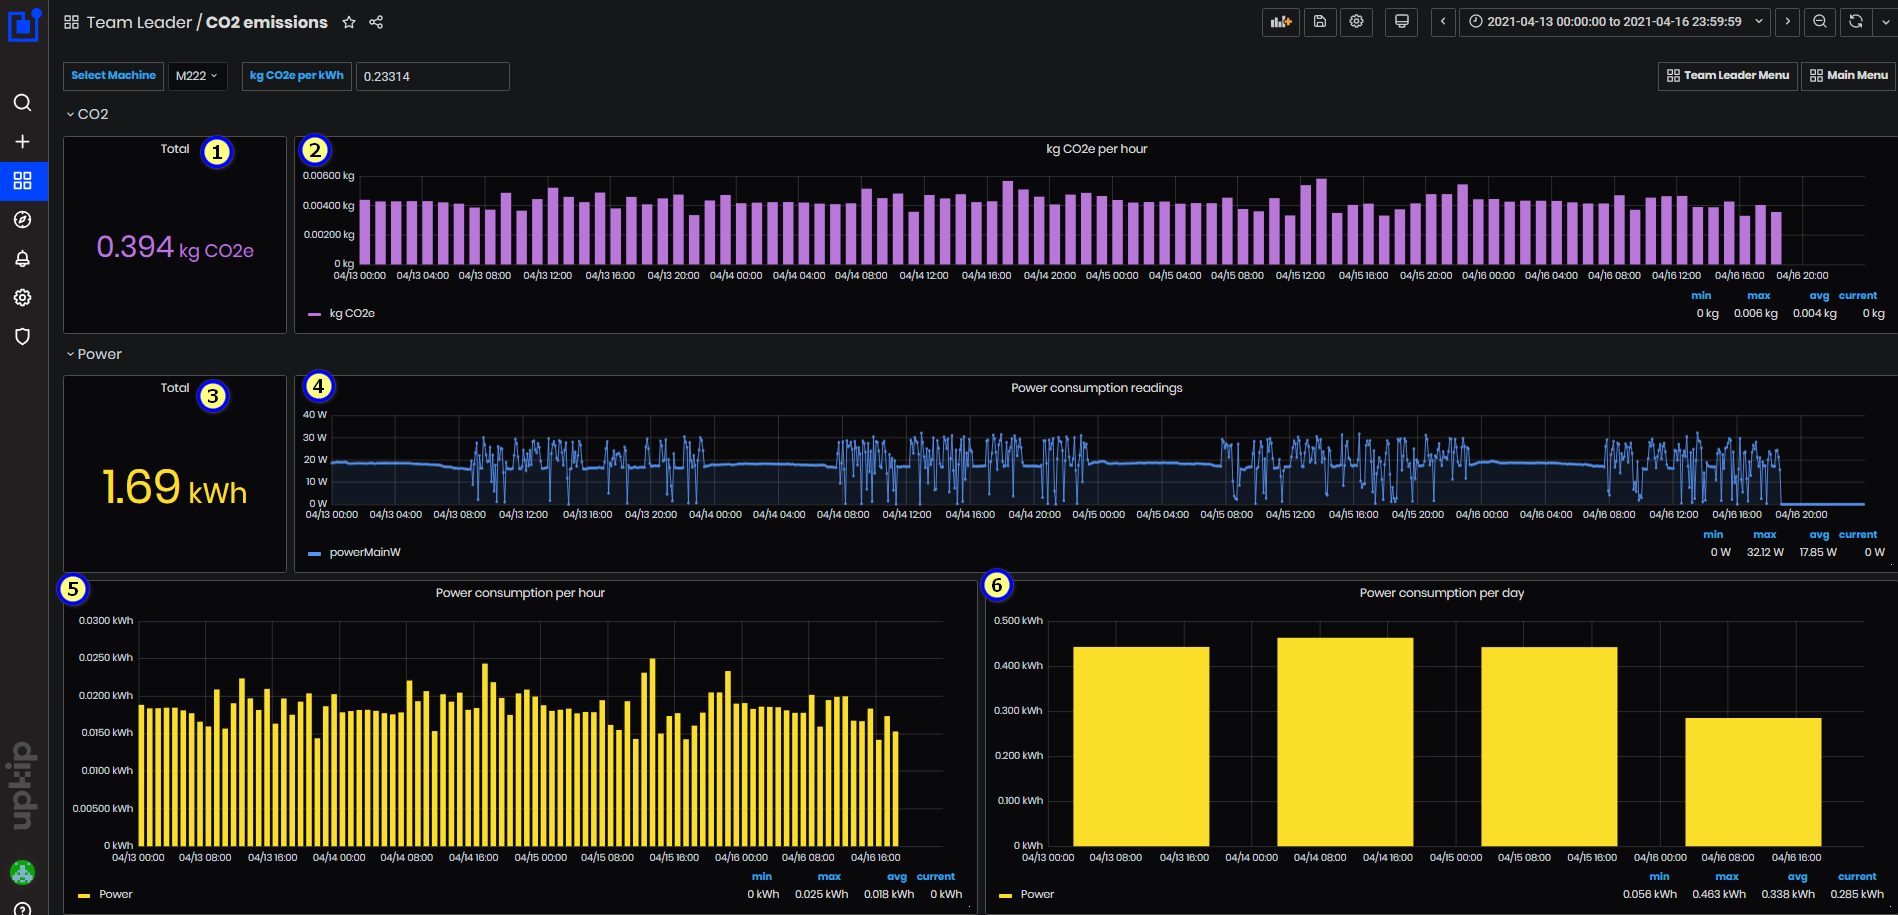
Figure 55: CO2 emissions dashboard
CO2e kg released = Power (kWh) * 0.23314
Machine M222 of type Nakamura NTY3-150 has connected ReMoni sensor - using tag powerMainW.
Expand the CO2 panel. For the selected time period are shown:
-
Total of CO2e (kg) released = Total power (kWh) * 0.23314
-
Graphic of COe (kg) per hour
Expand the panel Power. The power is measured from the machine M222 tag powerMainW.
For the selected time period are shown:
- Total of measured machine power (kWh) by the tag powerMainW
- Graphic Power consumption readings in (W) per datetime. Min, max, average, and current power are calculated.
- Graphic of the Power consumption (kWh) per hour
- Graphic of the Power consumption (kWh) per day
Expand the panel Item type.
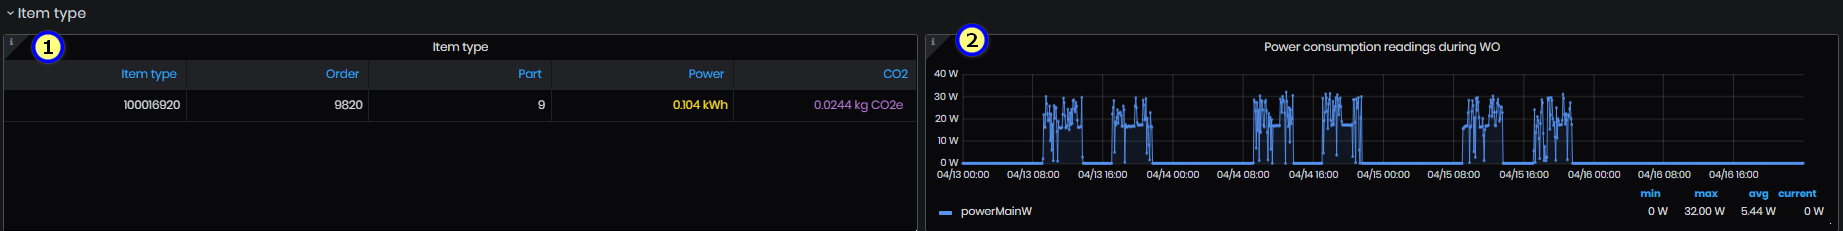
Figure 56: CO2 emissions - Item type panel
Panel displays for the selected time period:
- Energy and CO2 by the Item type produced. In the table are shown Item type, Order, Part, Power (kWh) and CO2 (kg) =Power (kW) * 0.23314. Item type is connected with order and part.
- Power usage readings (W) during the time logged for the work orders (date-time).
Expand the panel Status and Tool usage.
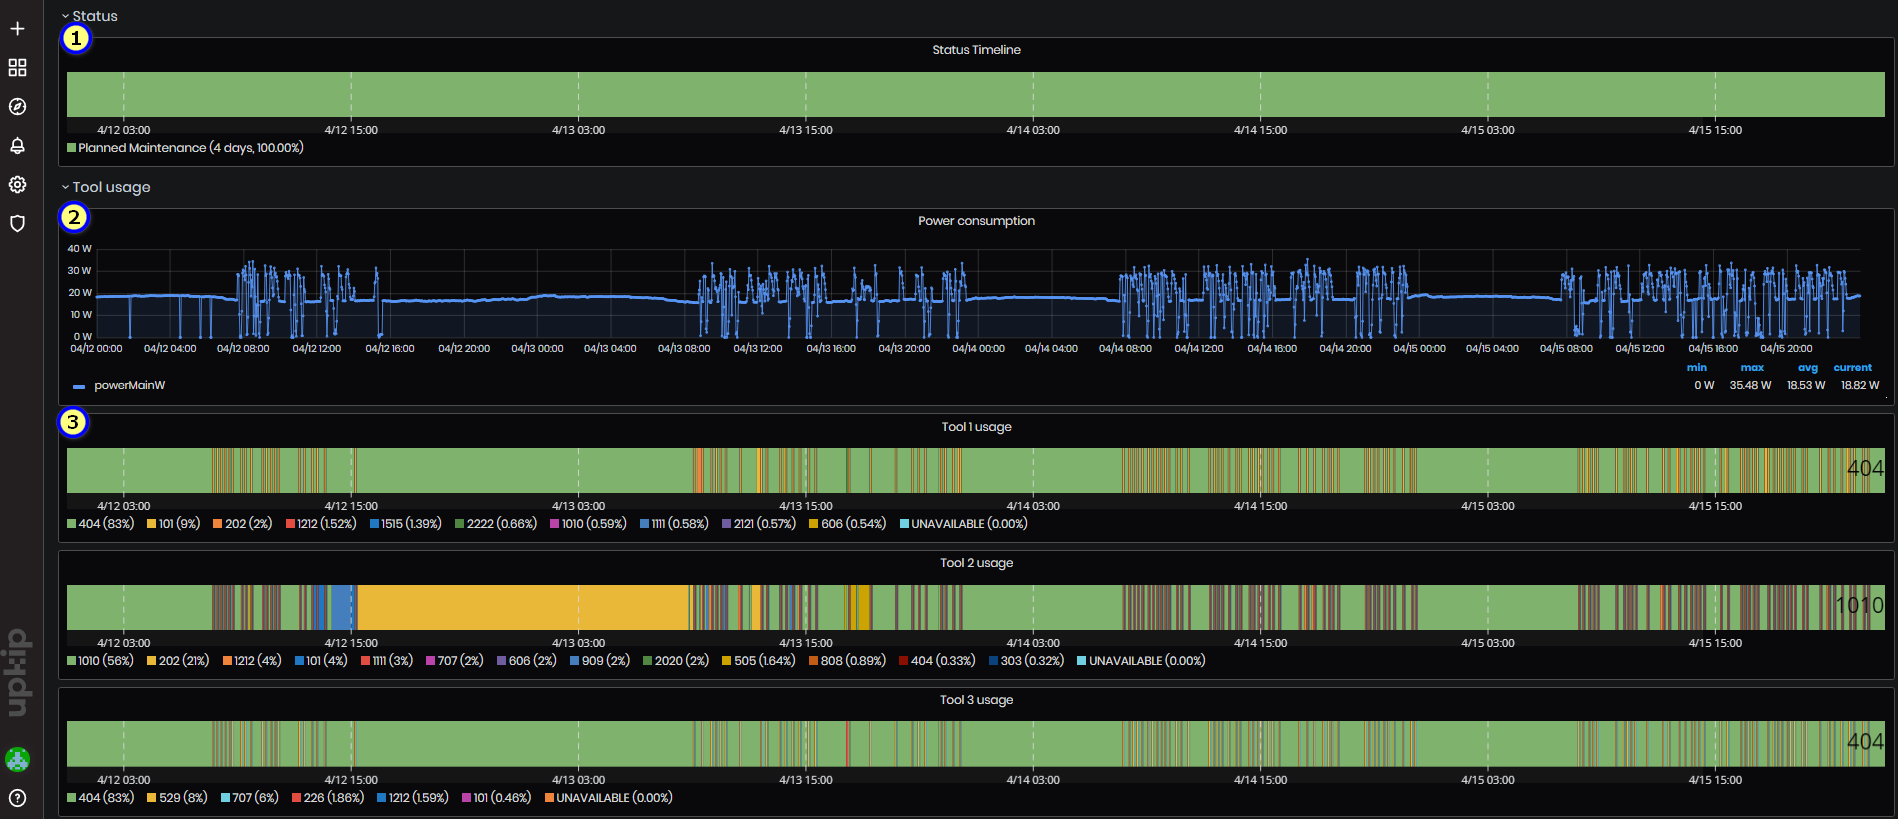
Figure 57: CO2 emissions - Status and Tool usage
In the panel Status is shown:
- Chart with machine statuses during the selected time period. For each status is shown the duration of time and percentage.
In the panel Tool usage are shown:
-
Graphic for power consumption (W) for the selected time period. Power is from ReMoni sensor connected to machine tag powerMainW.
-
Three charts for usage of the tools – Tool1, Tool2, Tool3 for the selected time period. For each number of machine tool is shown percentage of time.
Power KPIs
To open Power KPIs dashboard select:
- Team Leader/Power KPIs
- Power KPIs dashboard opens.
Purpose: The KPIs dashboard shows statistics about:
- Total power consumption and average consumption used for the production of one item.
- Total power cost and average power cost for the production of one item. The KPIs are calculated for a specific part identified by its unique Item Code, which is internal and specific to the customer.
Average energy used for one item is the weighted power consumption for the production of an item in an order as the sum of the weighted power consumptions of each part (position). The parts are calculated as the sum of the weighted power consumptions of each operation.
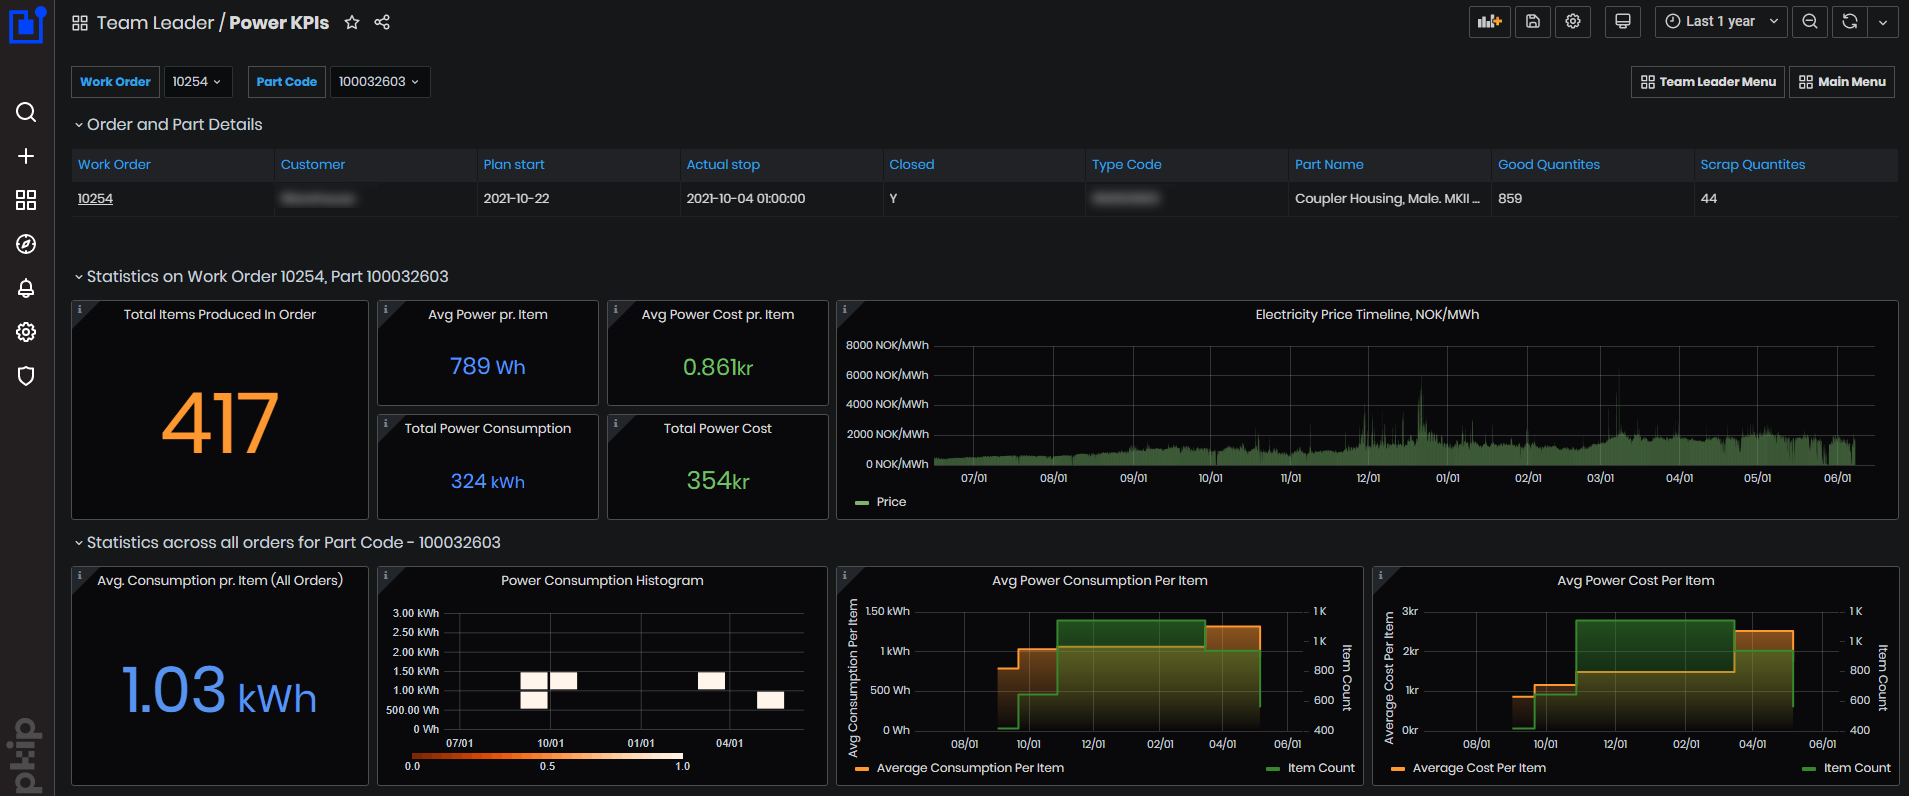
Figure 58: Power KPIs dashboard
Statistics on the dashboard are filtered by Work order number and by part code.
Order and Part Details panel.
It shows work order number, customer, order plan start date, order actual stop date, if closed or not (Y/N), type code, part name, the numbers of good quantities and scrap quantities.

Figure 59: Power KPIs - order and part details
Statistics on work order and part panel.
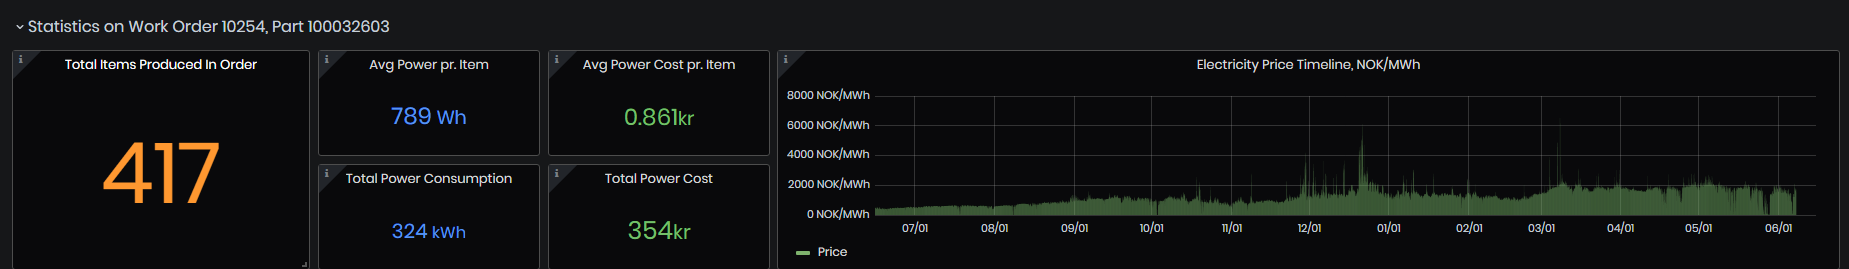
Figure 60: KPIs dashboard - statistics on work order and part
- Total items produced in order - Total quantity of produced items in the order as the sum of all Good Quantities across all positions that have at least one machine with power data.
- Avg Power pr. Item - Average power consumption per item for the order, only taking into account the machines that we have power data from.
- Total Power Consumption - Total power consumption for the order, only taking into account the machines that we have power data from.
- Avg Power Cost pr. Item – Average power cost per item for the order.
- Total Power cost - Total power cost for the selected item from the order.
- The Electricity price timeline - It is shown for the selected time period.
Statistics across all orders for the selected part panel.
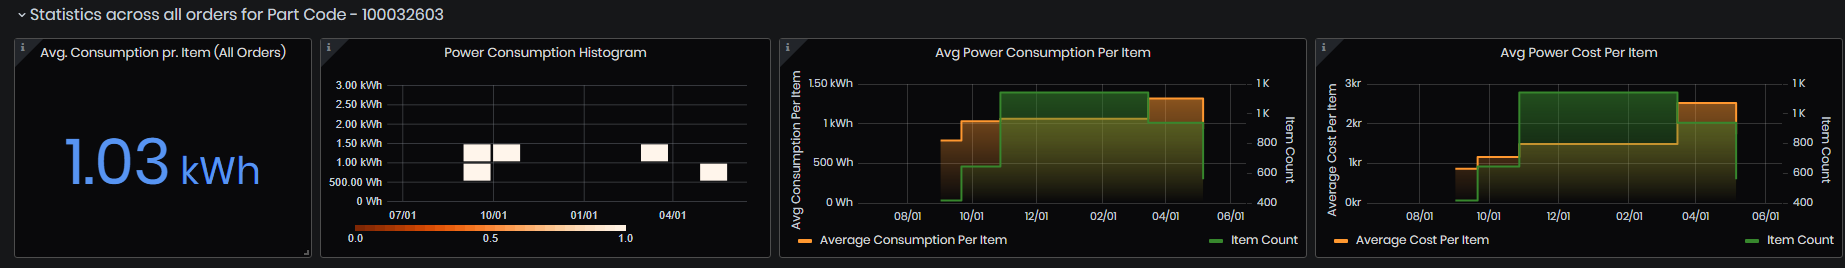
Figure 61: KPIs dashboard - statistics across all orders for the selected part
- Average Consumption per Item (all orders).
- Power Consumption per item histogram.
- Average Power Consumption per item - each bar is the value for a given order. Data is displayed for all orders in the selected time period that have power data available.
- Average Power Cost per item - each bar is the value for a given order. Data is displayed for all orders in the selected time period that have price data available.
Average consumption per item on work order
The power consumption per part KPI represents the average power consumption used for the production of one item. The resulting value is in energy consumption (Wh). The KPI is calculated for a specific part identified by its unique Item Code, which is internal and specific to the customer.
Average energy used for one item is the weighted power consumption for the production of an item in an order as the sum of the weighted power consumptions of each part(position). The parts are calculated as the sum of the weighted power consumptions of each operation.
Calculation:
-
For each part (position):
- For each operation:
-
Iterate through the work logs:
- Sum all quantities produced (both good and scrap quantities):
OperationTotalQuantity += (OperationLog[i].GoodQuantity)
- Calculate the total power consumption for the operation as sum of power consumptions during the work logs for operation.
OperationTotalPowerConsumption += OperationLog[i].PowerConsumption
- Get the average power consumption per item for the operation:
OperationPowerConsumptionPerItem = OperationTotalPowerConsumption / OperationTotalQuantity
-
- For each operation:
-
Sum the OperationPowerConsumptionPerItem values of all operations in the part (position):
PositionPowerConsumptionPerItem +=OperationPowerConsumptionPerItem
-
Sum the PositionPowerConsumptionPerItem values for all parts (positions) in the order.
WOPositionsPowerConsumptionPerItem += PositionPowerConsumptionPerItem
-
Divide the sum of power consumptions of all positions by the number of positions, to get the average:
WOAveragePowerConsumptionPerItem= WOPositionsPowerConsumptionPerItem/NumberOfPositions (kWh)
Average consumption per item across all work orders
The KPI Average power consumption per item is calculated also across all work orders with the same item code.
Calculation:
-
For all work orders with the same item code:
- Sum the average power consumption per item.
AllWOPositionsPowerConsumptionPerItem += WOPositionPowerConsumptionPerItem
-
Divide the sum by the number of positions in all work orders, to get the average:
AllWOAveragePowerConsumptionPerItem= AllWOPositionsPowerConsumptionPerItem/AllWONumberOfPositions (kWh)
Total Order Power Consumption
The KPI Total Order Power Consumption shows the power consumption in (kWh) for operations for all parts in the work order.
With the same steps as above sum the power consumption of all operations in all parts (positions) in the order.
Calculation:
-
For each part:
-
For each operation:
OperationTotalPowerConsumption += OperationLog[i].PowerConsumption
PartTotalPowerConsumption += OperationTotalPowerConsumption[i]
-
TotalOrderPowerConsumption += PartTotalPowerConsumption[i] (kWh)
Note: Cases when the calculations may be skewed:
- If some of the machines that are used in the order don’t have power consumption sensors – the operations and work logs on those machines will not be part of the calculations and will skew the result for the order.
- If the work time logged for machines is incorrect the power consumption values will not be correct.
- Across different orders the scrap quantity will affect the calculations for average power consumption (more scrap equals higher average power consumption).