Supervisor Menu
To open the Supervisor dashboards select:
- Main menu/Supervisor.
- The Supervisor dashboards menu opens.
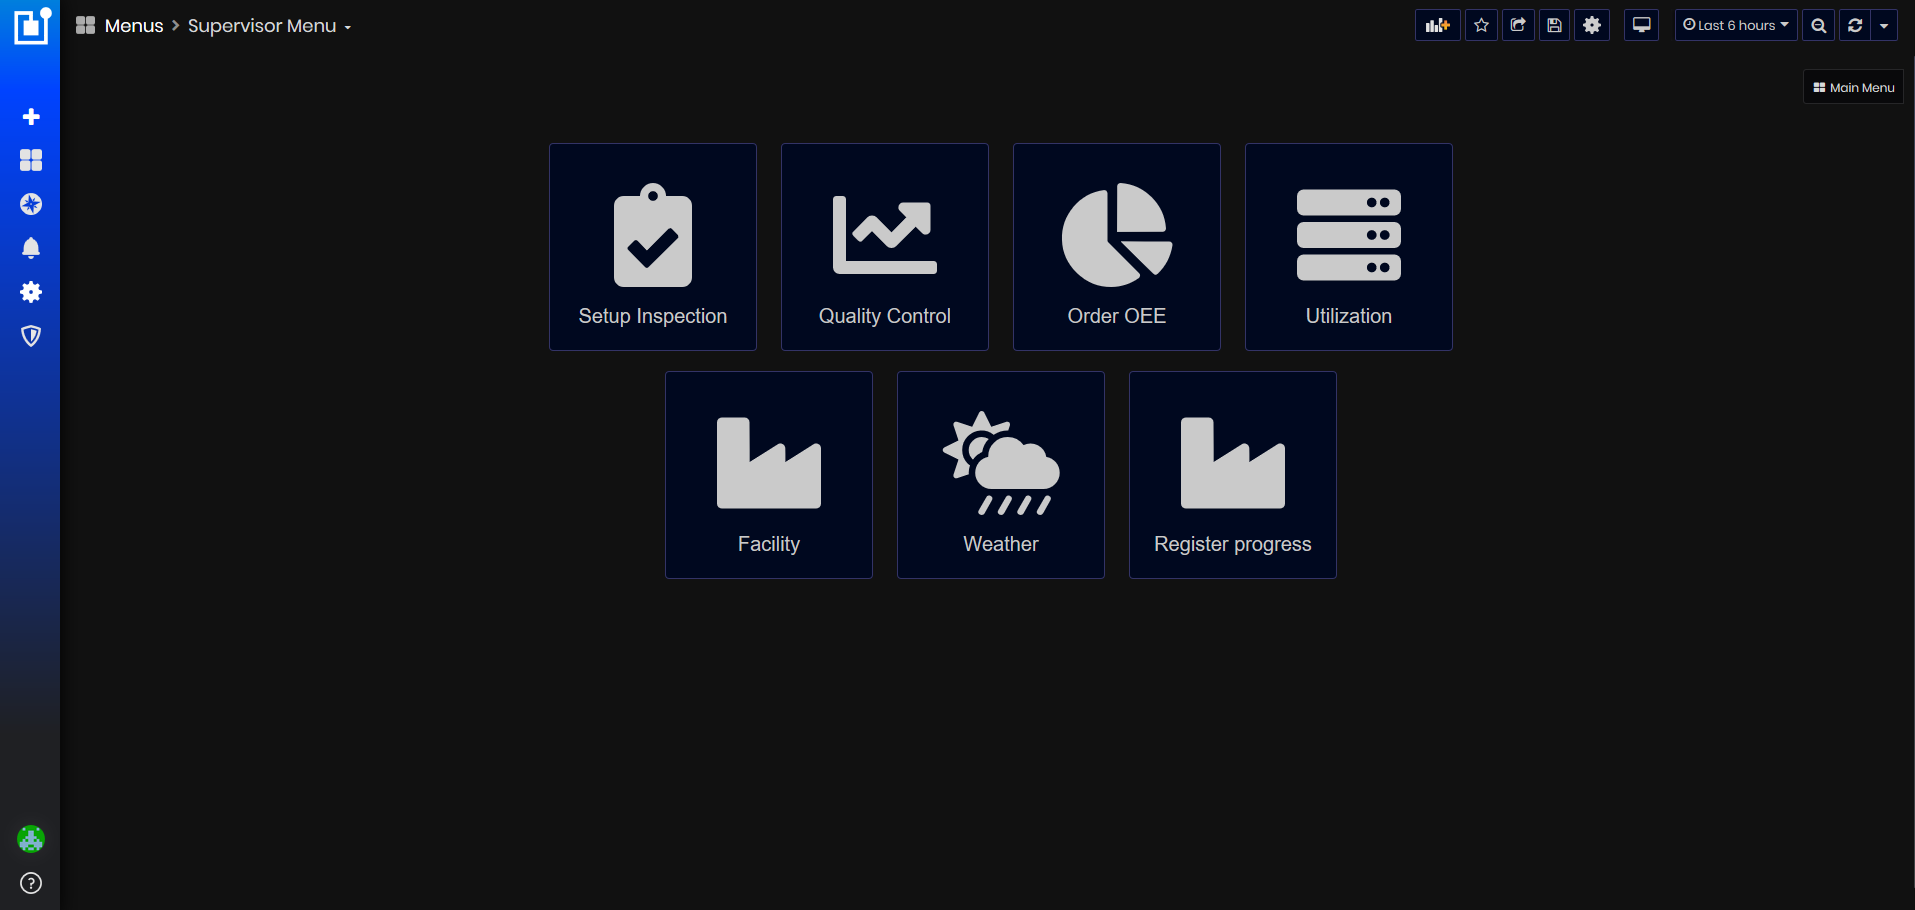
Figure 1: Supervisor dashboards menu
Setup Inspection
To open the Setup Inspection dashboard select:
- Supervisor/Setup Inspection:
- The Setup Inspection dashboard opens.
Purpose: Dashboard Setup Inspection shows information about planned set up inspections.
The information has been imported from the system SAPB1 (SAP Business 1) and visualized.
Using this dashboard, QA personnel can prioritize orders configuration inspections:
- Ready for control date and time are used for prioritization.
- Inspection with the longest pending time are prioritized (red time with clock).
- If orders awaiting control and the next operation (blue arrows) have not yet started they should have a higher priority.
- If the next operation has started (blue arrows) before completing of the inspection, it should have the lowest priority.
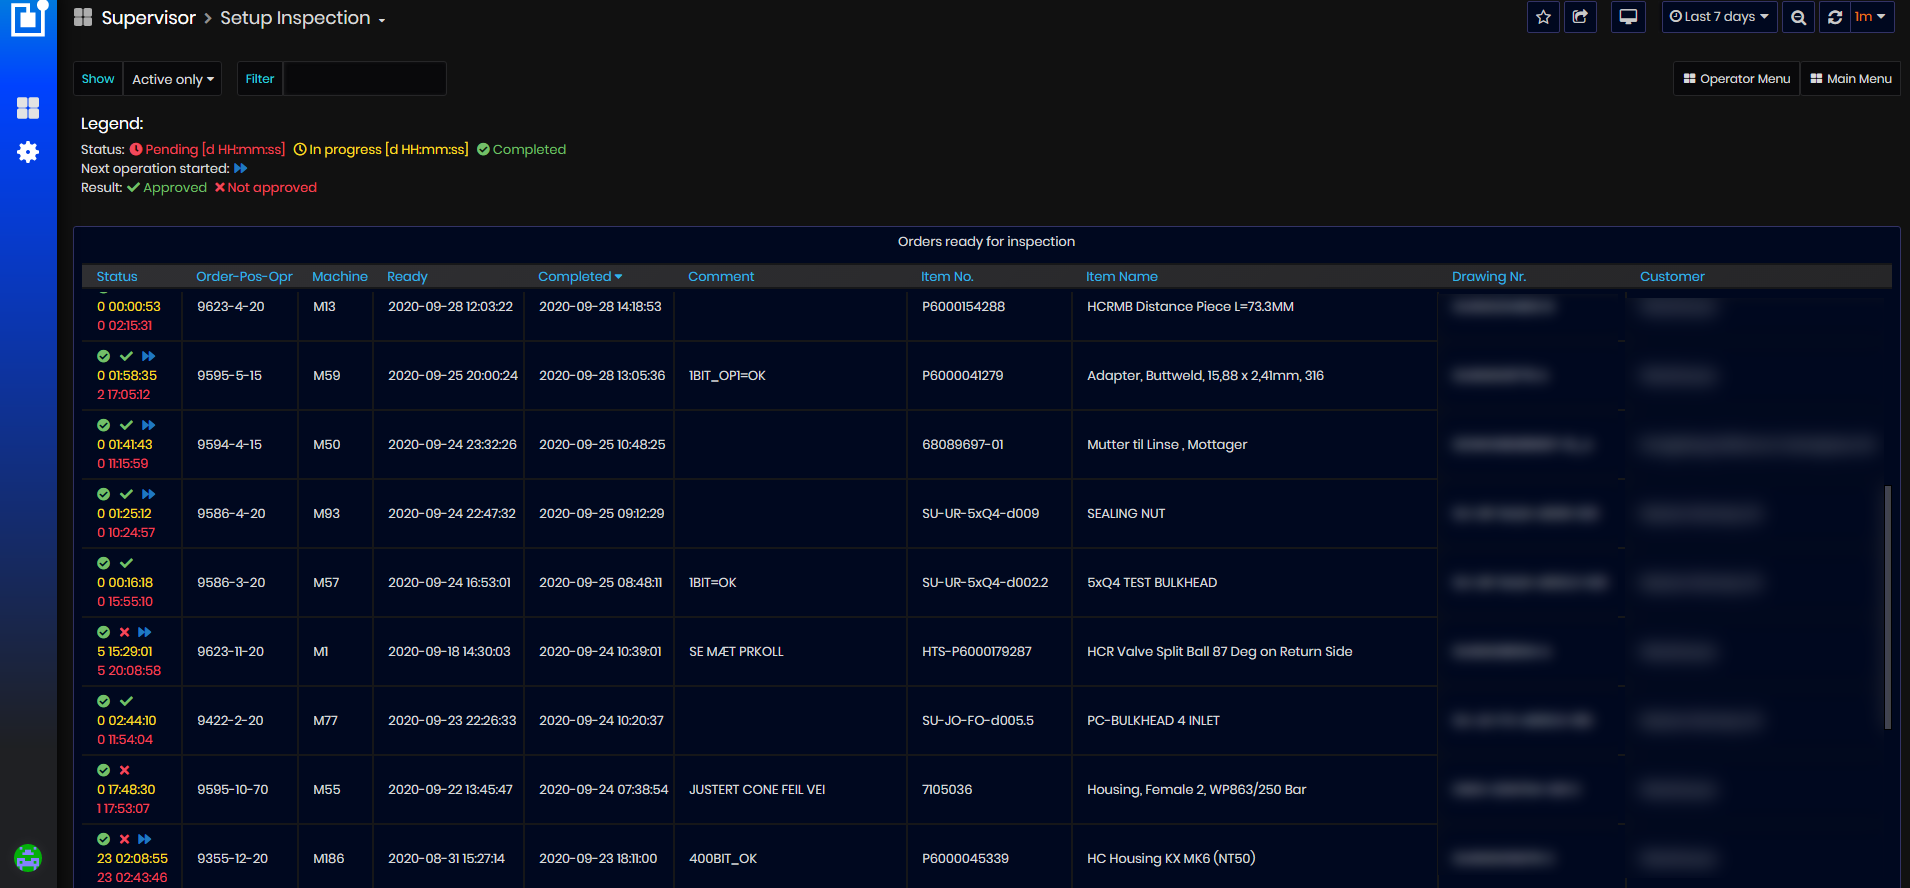
Figure 2: Setup Inspection dashboard
The Setup Inspection dashboard displays the following information:
The Status column gives the following information:
-
Result of the inspection- approved or not approved

Figure 3: Setup Inspection dashboard - Result status
-
Red time with clock (pending) – shows times (days hours:minutes: seconds) elapsed since the order appears in the list until the completion of the inspection
-
Yellow time with clock (in progress) – shows times (days hours:minutes: seconds) elapsed since the order inspection has started until completion of the inspection.
-
Completed – inspection has been completed. When the inspection is completed the clock before the times is removed.

Figure 4: Setup Inspection dashboard - Inspection Status
-
Next operation started – show blue arrows when the next operation has been started. The blue arrows remain after completion of the inspection. Sometimes is possible to start the next operation before completion of the inspection.

Figure 5: Setup Inspection dashboard - Next operation started
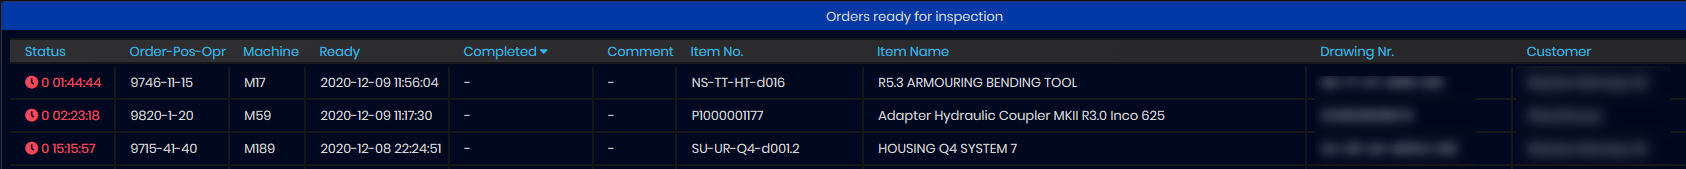
Figure 6: Setup Inspection dashboard - Orders ready for inspection
- Order-Pos-Opr – shows order number - position-Operator.
- Machine – Machine name.
- Ready - Date and time when the order is ready for inspection.
- Completed - Date and time when the order inspection has been completed.
- Comment - Comment about inspection.
- Item No - Part No.
- Item name - Part Name.
- Drawing Nr - Additional identification of the part based on the Item No.
- Customer name - The customer name.
Filtering Setup Inspections by Active only/All
-
Active - List shows only active inspections that are not closed
-
All - Shows all orders that have ever existed in the system.
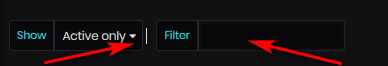
Figure 7: Setup Inspection dashboard - Filtering setup inspections
There is a Filter field and the setup inspection can be filtered by entering part of: Order number, Customer, part position, Item No., Item name, or Drawing Nr.
Work order OEE
To open the Work Order OEE dashboard:
- As a user with role Team Leader select: Main Menu/Team Leader/Machines click on the work order link.
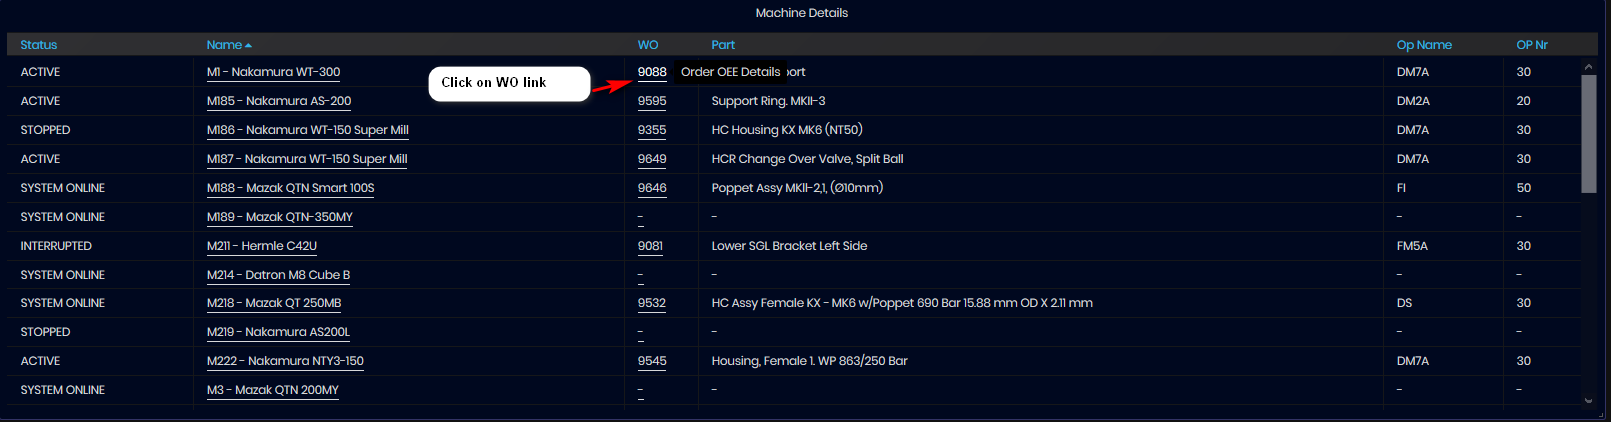
Figure 8: Machines dashboard - Machine Details - WO number link
-
As a user with role Supervisor select: Main Menu/Supervisor/Order OEE
- The Work Order OEE dashboard opens.
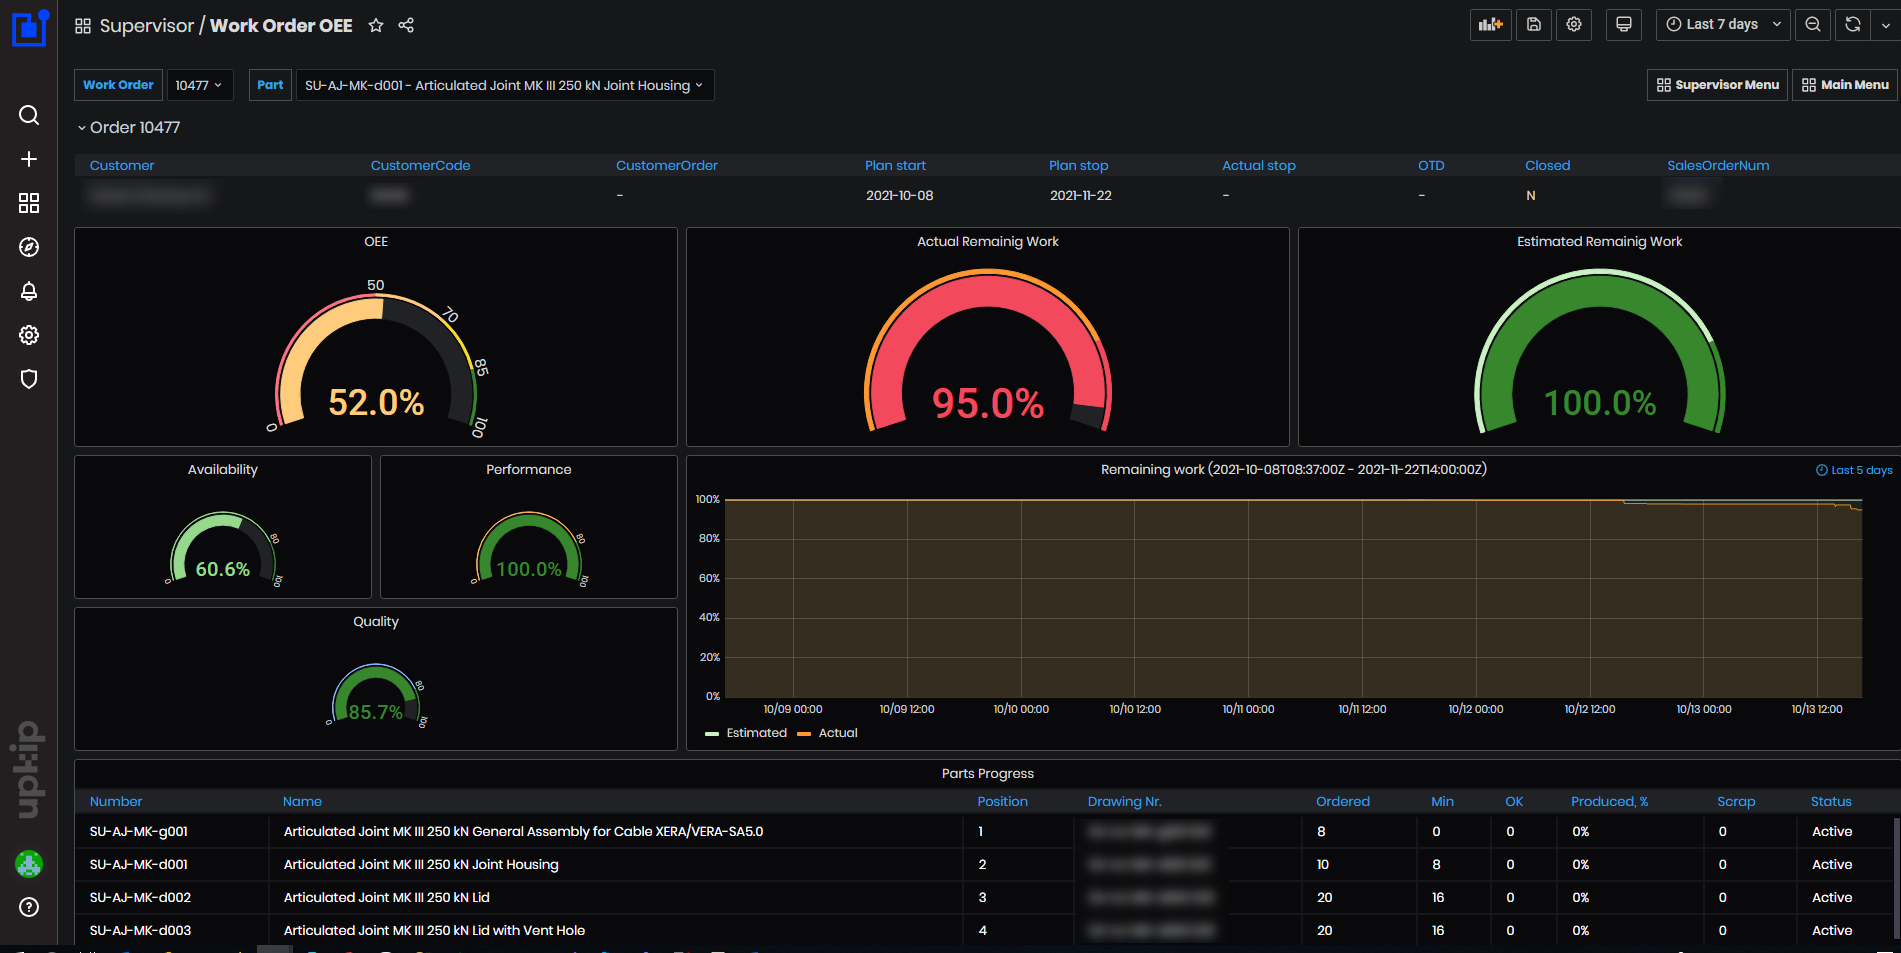
Figure 9: Work Order OEE dashboard
Information for work orders is imported from the SAP Business 1 system.
Purpose: This dashboard shows detailed information and KPIs for the selected work order and part, work order parts KPIs and average KPIs per selected part item code.
Work Order OEE information is loaded for the selected work order and part of the filters.

Figure 10: Work Order OEE dashboard - Filters
On the dashboard are shown the following KPIs for work order and parts:
Work Order KPIs
- Work Order OEE (%)
- Work Order Availability (%)
- Work Order Performance (%)
- Work Order Quality (%)
- Work Order OTD (days)
- Work Order Estimated Remaining Work (%)
- Work Order Actual Remaining Work (%)
- Work Order Cost Deviation (kr)
Parts KPIs
- Parts Time Per Item (s/min/hour)
- Parts Scrap Percentage (%)
- Parts Cost Deviation (kr)
- Parts Estimated Remaining Work (%)
- Parts Actual Remaining Work (%)
- Parts Overplanning (%)
- Parts Average Production cost (kr)
- Parts OTD (Y/N)
Average KPIs per ItemCode
Additional information
- Order Parts Progress
- OTD per department (Y/N)
- Part progress per operation
- Utilizations of machines used in the operations of the part
Work Order
A work orders satisfy the supply-demand by either external or internal needs. They identify equipment, effort, and terms. Work orders capture data, maintain the history, and have a predefined lifecycle, which may differ from manufacturer to manufacturer. Reporting and monitoring are performed on planned vs actual for the work order. Typical attributes for a work order are:
- Order Number – unique identification
- Customer – the organization from which the order originates
- Planned Start – the date and time when the order is scheduled to start.
- Planned Stop – the date and time when the order is scheduled to complete.
- Status – the status of the order
- Created Date – the date the order was created in the system
- Changed Date – the date the order was last updated
- Actual Stop – the date and time the order was completed
- Closed – the indication whether the order has been closed. The order could be closed before it is actually completed, or not closed even when completed.
Part (Position)
A Position(Part) in the work order is the identification and recipe of steps to be performed in order to produce a valuable result. Typical attributes for a work order position are:
- Work order ID – reference to PWO
- Position – unique ID or number of position
- Name – name and description of the part produced
- Quantity – number of parts that are ordered
- Minimum Quantity – the minimum quantity (number smaller or equal to quantity) of good parts with acceptable quality
- Drawing number – unique number that describes the origin of the part design
- Created Date – the date when the record for part is created
- Changed Date – the date when the record for part was last edited
- Actual Stop – the date when all parts from the position on the current order are produced
- Closed – identification on whether the position is closed. Position could be closed before it is actually completed, or not closed even when completed.
- Good Quantity – number of part items produced with good quantity
- Scrap Quantity – number of part items produced that have not passed quality control
- Internal Delivery Date – date and time for internal scheduling for the manufacturer, when the position shall be closed.
- Item Code – code for identification across orders which uniquely identifies the type of part
Operation
An operation on part is a step of the process to produce a part. Operations may not require machines and may not need execution for every part item. (i.e. Initial configuration is done for a single item). Typical attributes for operation are:
- Order Part ID – the reference to order part
- Number – unique number of the operation across a single part manufacturing process
- Name – the name of operation
- Planned Start – the datetime for when the operation has been planned to start
- Planned Stop – the datetime for when the operation has been planned to complete
- Actual Start – the datetime of actual start of the operation
- Actual Stop – the datetime of actual completion of operation on all part items
- Ready for Control – indication on whether the outcome from the operation is ready to be inspected for quality deviations
- Control Started – the datetime when the control has started
- ControlCompleted – the datetime when the control is completed
- Created Date – the date when the record for operation is created
- Changed Date – the date when the record for operation was last edited
- Closed – identification on whether the operation is closed
- Good Quantity – number of good items that have passed through the operation
- Scrap Quantity – number of items that have passed through the operation that have not passed quality control
- Department – the department responsible for operation execution
- TypeCode – unique identification of operation for comparison across other orders and executions (i.e. the same operation shall always run the same CNC program)
Work Order OEE
The KPI Overall Equipment Effectiveness (OEE) is the gold standard for measuring manufacturing productivity. It identifies the percentage of manufacturing time that is truly productive. An OEE score of 100% means the manufacturer produces only Good Parts (100% Quality), as fast as possible (100% Performance), with no Stop Time (100%). OEE is considered the single best metric for or identifying losses, benchmarking progress, and improving the productivity of manufacturing equipment.

Figure 11: Calculation of Work Order OEE
Calculation:
Work Order OEE (%) = Availability (%) * Performance(%) * Quality(%)
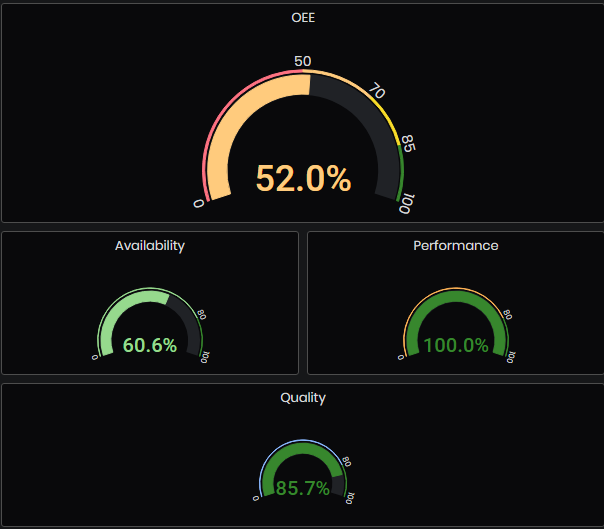
Figure 12: Work Order OEE dashboard - Work order OEE, Availability, Performance, Quality
Work Order Availability
Identify machines producing parts for a particular order and then find the downtime for the interval while the machine was working on an operation for the specific order (based on the data from Downtime Tagging). Calculated only for machines registered in the system, for which there is time-tracking information in ERP. To Machine Availability
Calculation of Work Order Availability:
- For each operation
-
Iterate through time tracking reports and sum up time spent on operation level:
OperationTimeTotal += OperationLog[i].EndDate - OperationLog[i].StartDate
-
Get the machine downtime during the actual operation period and sum for all operations
DowntimeTotal(WO) += Downtime.Operation[i]
-
Work Order Availability = (OperationTimeTotal-DowntimeTotal(WO))/OperationTimeTotal
Work Order Performance
Same as machine-level performance but calculated on all operation logs under the specific Order. To Machine Performance
Calculation steps
- For each operation
-
Iterate through time tracking reports and sum up time spent on operation level:
OperationTimeTotal += OperationLog[i].EndDate - OperationLog[i].StartDate
-
To calculate IdealTimeTotal iterate through operations details. IdealCycleTime is equal to TimePerItem.
IdealTimeTotal += (TimePerItem[i] * OperationLog[i].producedQuantity)+SetupTime
-
Work Order Performance = (IdealTimeTotal / OperationTimeTotal) * 100;
Work Order Quality
The same as machine-level quality but calculated on all work order parts under the specific Order. We take the sum of all scrap, and the minimum good items produced by operations under the part. Then for the order we sum from all parts the total of good and total of scrap items.
The Work Order Quality is calculated as:
- For each operation
-
Iterate through time tracking reports and sum up logs for good quantity
GoodPartsTotal += OperationLog[i].GoodParts
-
Iterate through time tracking reports and sum up logs for scrap quantity
ScrapPartsTotal += OperationLog[i].ScrapParts
-
Calculation Steps
- MinGoodPartsTotal – the minimum of good parts (GoodPartsTotal) across all operation
- SumScrapPartsTotal – the sum of scrap parts across all operations(ScrapPartsTotal)
Work Order Quality = (MinGoodPartsTotal) / (MinGoodPartsTotal + SumScrapPartsTotal) *100
Work Order OTD (On Time Delivery)
This KPI represents the amount of days latency from planned, which is already accumulated. The result is represented as the difference (in days) between the two dates and can be a negative or positive number.
Example for work order delivered with delays – OTD (days) is positive
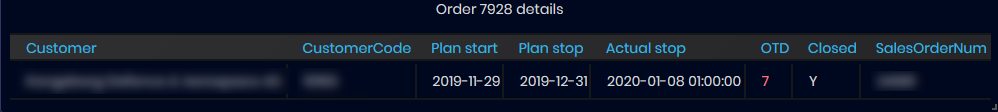
Figure 13: Work Order OEE - Order details -positive OTD
Example for work order delivered before planned stop date – OTD(days) is negative
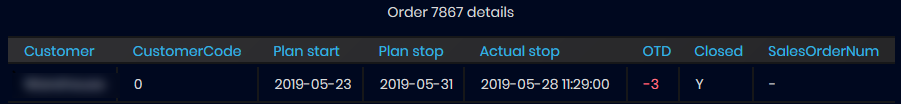
Figure 14: Work Order OEE - Order details -negative OTD
-
Work Order (OTD)
- For Open work orders OTD is calculated:
OTD = today’s date- Plan stop date - For Closed work orders OTD is calculated:
OTD = Actual stop date -Plan stop date
Note: OTD is re-calculated for orders closed in the last 10 days, in order to avoid issues in case the Plan stop date is changed.
- For Open work orders OTD is calculated:
OTD for a work order is a positive number (days) when there are delays from planned stop date.
OTD for a work order is a negative number (days) when work order finished before planned stop date.
Work Order Estimated Remaining Work
The KPI Work order estimated remaining work represents how much of the work for work order should be remaining - 100% in the beginning and 0% at the end of the period. The calculation is based on the planned time period for production of each operation under the work order parts and the amount of time left, compared to the moment of calculation.

Figure 15: Work Order Estimated remaining work
The calculation is based on the following data for each order part under the work order:
-
EstimatedRemainingWorkPerPart (%) – To EstimatedRemainingWorkPerPart calculation
-
PartOrderedQuantity - the ordered quantity for a part.
-
WorkOrderTotalOrderedQuantity – the sum of all ordered items of all order parts under the work order.
-
WorkOrderTotalOrderedItems += Part[i].OrderedQuantity
Calculation:
For each work order part find the relative estimated remaining work, then add it to the result:
WorkOrderEstimatedRemainingWork += (((EstimatedRemainingWorkPerPart / 100) * PartOrderedQuantity) / WorkOrderTotalOrderedQuantity) * 100 (%)
Work Order Actual Remaining Work
The KPI Work order actual remaining work represents the current progress for work order and the actual remaining work in percentage based on the number of ordered items to be produced and the number of items already produced.

Figure 16: Work Order Actual remaining work
The calculation is based on the following data for each order part under the work order:
-
ActualRemainingWorkPerPart – To ActualRemainingWorkPerPart calculation
-
PartOrderedQuantity - the ordered quantity for a parts of work order.
-
WorkOrderTotalOrderedQuantity – the sum of all ordered items of all order parts under the work order
-
WorkOrderTotalOrderedItems += Part[i].OrderedQuantity
Calculation:
For each work order find the relative actual remaining work, then add it to the result:
WorkOrderActualRemainingWork += (((ActualRemainingWorkPerPart/ 100) * PartOrderedQuantity) / WorkOrderTotalOrderedQuantity) * 100 (%)
Work Order Cost Deviation
The KPI Work Order Cost deviation represents a deviation between actual time and planned time, for the work order. Fist are calculated cost deviations for operations under the part and then for all parts in the order.
Calculation:
- For each operation under the part
- Calculated Operations cost deviations. See calculation of Operation Cost Deviation
- For each part from the work order
- Calculated Part Cost Deviations. See calculation of Part Cost Deviation
PartCostDeviation += Operation[i].CostDeviation
- For a work order
- Calculated Work Order Cost Deviation, as a sum of parts cost deviations.
WorkOrderCostDeviation += Part[i].CostDeviation
Note: The result is calculated as duration, in hours. However in Grafana this value is multiplied by the “cost per hour” variable to display the KPI value as currency (NOK kr). Cost deviations can be positive or negative.
Order Parts Progress
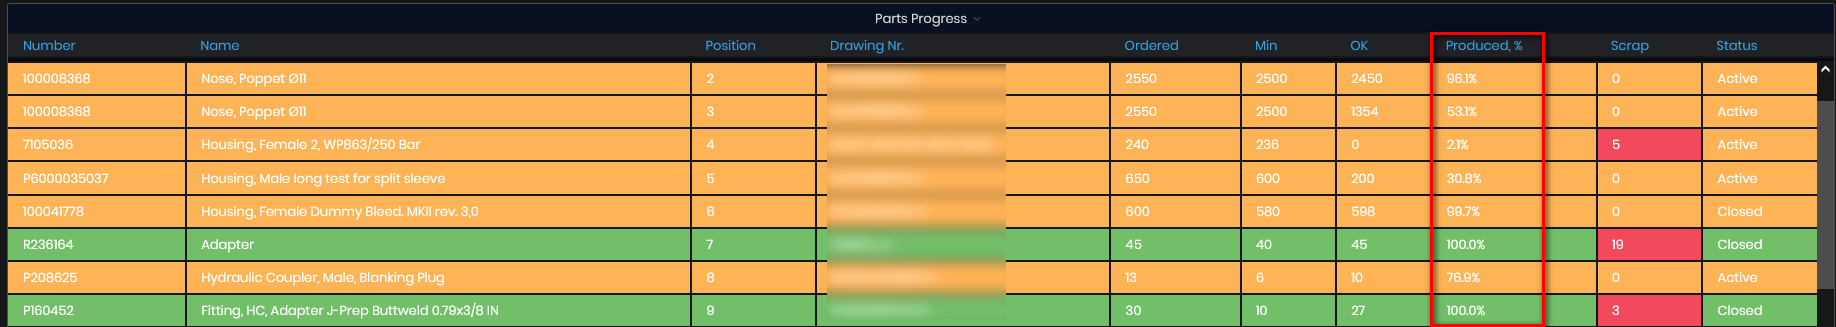
Figure 17: Work Order OEE dashboard - Order Part list
There is a listed table with information about details of all parts from the work order including: Number, Name of the part, Positions, Drawing Nr., Ordered quantity, Min quantity, OK quantity, Produced progress (%), Scrap quantity, Status for each part (Active or Closed)
Parts KPIs
The Part KPIs table shows information about part ID and name, position, time per item (time duration), scrap%, part cost deviation(kr), actual remaining work%, estimated remaining work%, overplanning% and avg production cost(kr).
Parts Time per Item
The order part time per item is a time for producing one part through all operations for the selected order part. The KPI represents the average time used for the production of one item. The resulted value is duration, in seconds/min/hours.
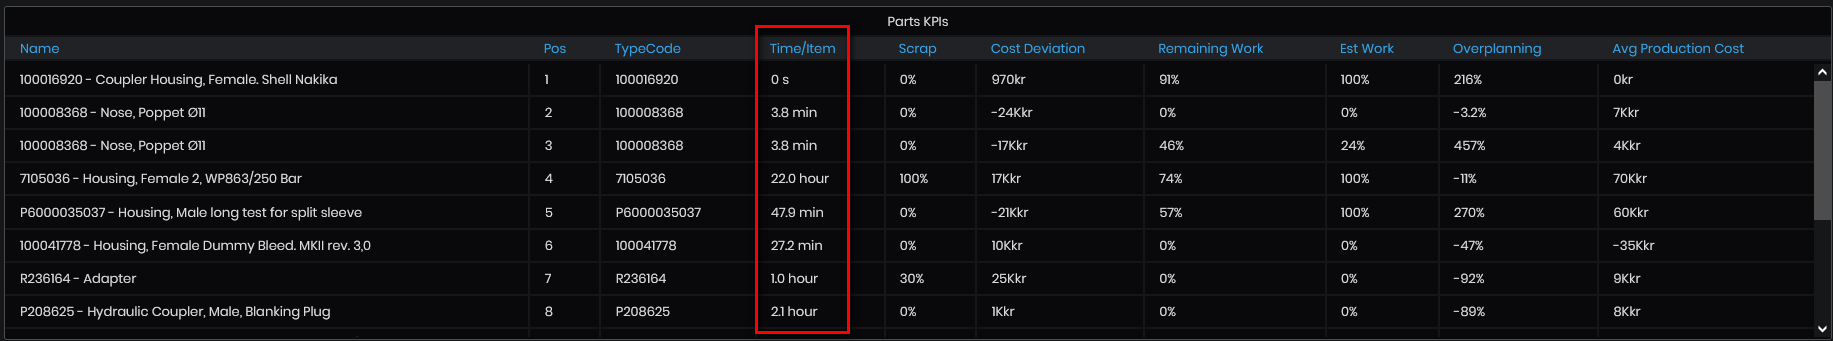
Figure 18: Work order OEE - Part KPIs - Time/Item
Calculation:
The data needed for this KPI consists of:
- ProductionDuration – the sum of all durations of operations (derived from operation details) under the order part.
- TotalPartsProduced – the sum of good parts and the sum of scrap parts across all operations under the order part.
PartTimePerItem = ProductionDuration / TotalPartsProduced (s/min/hour)
If duration or total parts produced are equal to zero, the result is zero min per item.
Parts Scrap percentage
The KPI represents the ratio between produced scrap quantity to the total produced quantity for each part in percentage.
The scrap % for each part is visible in the table Parts KPI.
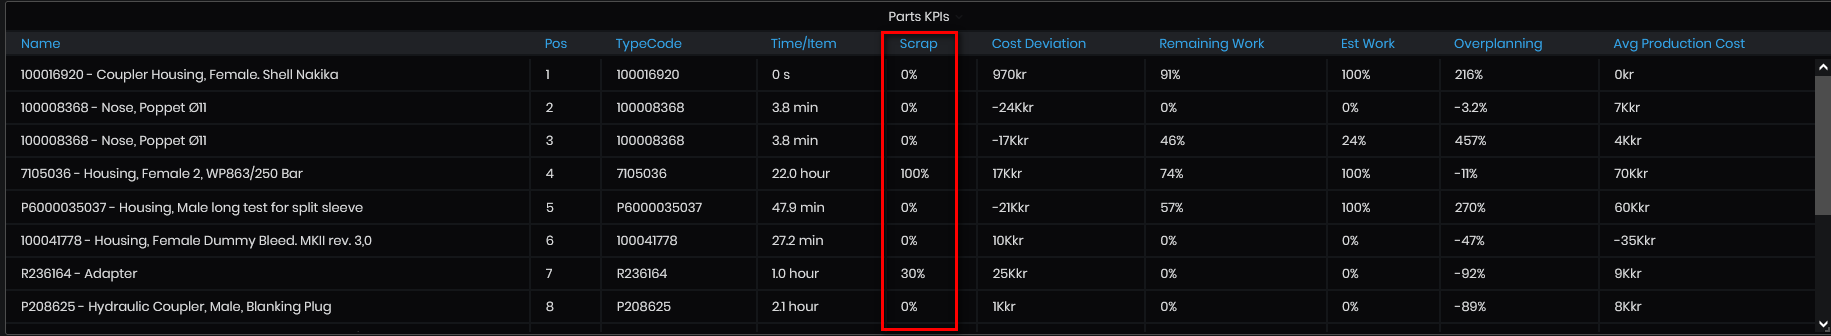
Figure 19: Work Order OEE dashboard - Part KPIs - Scrap%
The amount of produced items for the order part are based on items produced by all operations under that ordered part.
The KPI is calculated similarly to percent scrap for operation. The difference is that the number of good items in not a sum of all good items from the operations, but the minimum of good items. This means that if one of the operations produces less good items compared to the other operations, that number of items will be represented as produced good items for the order part.
Calculation:
-
For each part:
-
GoodItems = MIN (operation’s good items)
-
ScrapItems = SUM (operation’s scrap items)
-
PercentScrapPerPart = ScrapItems / (GoodItems + ScrapItems) * 100 (%)
Parts Cost deviation
This KPI represents the deviation between actual time and planned time, for the work order part. It is calculated first for each operation under the part.
Calculation:
- For each open (ActualStop is NULL) and closed (has ActualStop time) operation:
-
For SETUP operations:
OperationCostDeviation = OperationDuration – OperationSetupTime
-
For normal operations:
OperationCostDeviation = OperationDuration - (OperationSetupTime + (TimePerItem * GoodPartsProduced))
-
Sum the cost deviations for all operations for the part.
PartCostDeviation += Operation[i].CostDeviation
Note: The result is calculated as duration, in hours. However in Grafana this value is multiplied by the “cost per hour” variable to display the KPI value as currency (NOK kr). Part cost deviations can be positive or negative.
To calculation of Work Order Cost Deviation
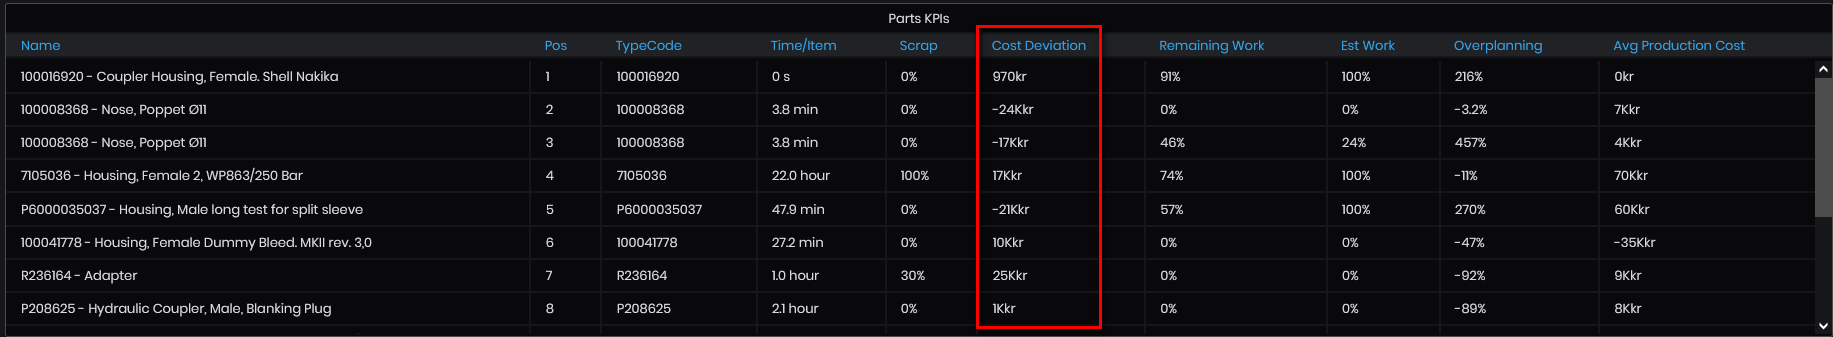
Figure 20: Work Order OEE - Part KPIs - Cost Deviation
Parts Estimated remaining work
The KPI Part estimated remaining work represents how much of the work should be remaining - 100% in the beginning and 0% at the end of the period. The calculation is based on the planned time period for production of each operation under the work order part and the amount of time left, compared to the moment of calculation.
On the panel Part KPIs are shown for each part percentage of estimated remaining work of the part.
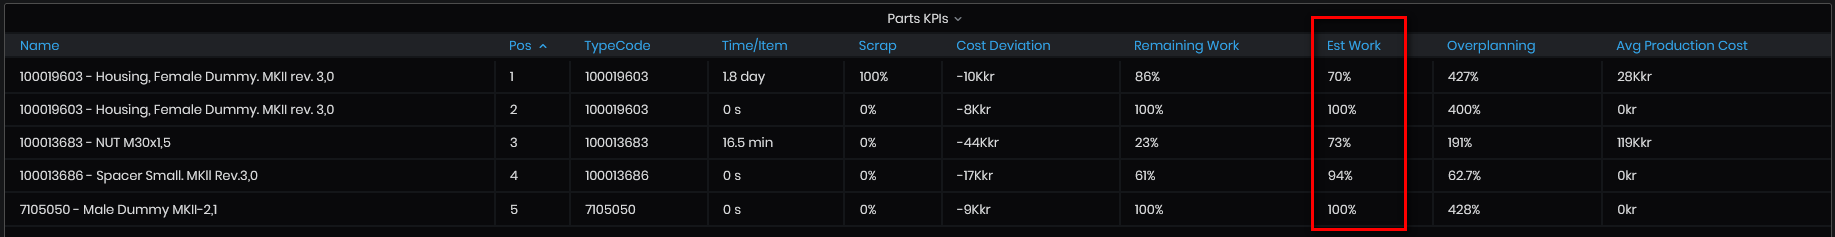
Figure 21: Work Order OEE dashboard - Part KPIs - Estimated remaining work of the part
The data needed for this KPI consists of:
- TotalPlannedTimePerPart – the sum of all planned time periods of all operations under the order part.
- RemainingTimePerPart – the sum of all planned periods of all operations under the order part, excluding the time before the moment of calculation.
If the difference between Operation.PlanStop-Operation.PlanStart=0, the operation planned duration is calculated by:
- OperationPlannedDuration = (TimePerItem*OrderedParts)+SetupTime
Calculation:
EstimatedRemainingWorkPerPart = (RemainingTimePerPart / TotalPlannedTimePerPart) * 100 (%)
To WorkOrderEstimatedRemainingWork calculation
Parts Actual remaining work
The KPI Part actual remaining work represents the current progress in percentage based on the number of items to be produced and the number of items produced.
On the panel Part KPIs are shown for each part percentage of actual remaining work of the part.
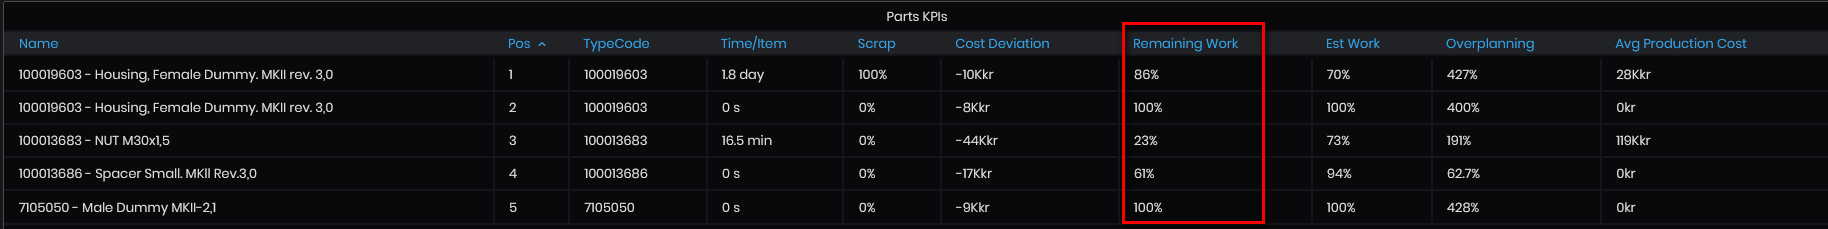
Figure 22: Work Order OEE dashboard - Part KPIs - Actual remaining work of the part
The data needed for this KPI consists of:
- TotalItemsProduced – the sum of the total parts produced (good and scrap) of all operations under the order part.
TotalItemsProduced += Operation[i].GoodQuantity+Operation[i].ScrapQuantity
-
TotalPlannedQuantity – this value is calculated by iterating all operations under the order part and adding the number of ordered items for each operation. However, if the previous operation has produced scrap, then that number of scrap items is subtracted from the ordered items for the next operations. And if the operation is closed, then the number of produced items is considered to be the ordered amount of items for the next operations.
-
When some operations are finished (Closed=1) but other are not finished
-
TotalItemsNotFinishedOperations =(LastFinishedOperationGoodQuantity * NumberOfNotFinishedOperations)-ProducedQuantityOfNotFinisedOperations
-
When all operations are not finished (Closed=0)
-
TotalItemsNotFinishedOperations=(NumberOfOperations*OrderedQuantity) - TotalItemsProduced
ExpectedTotalItemsToProduce = TotalItemsProduced + TotalItemsNotFinishedOperations
Calculation:
ActualRemainingWorkPerPart = (100 – (TotalItemsProduced / ExpectedTotalItemsToProduce)) * 100 (%)
To WorkOrderActualRemainingWork calculation
Parts Overplanning
The Part Overplanning KPI shows the deviation between planned time for the execution and actual time it took for execution.
For each part is shown Overplanning KPI in percentage. Overplanning % can be positive or negative.
Negative Overplanning% means that planned time per part is less than real time for producing part of the same type.
Positive Overplanning % means that planned time per part is greater than real time for producing part of the same type.
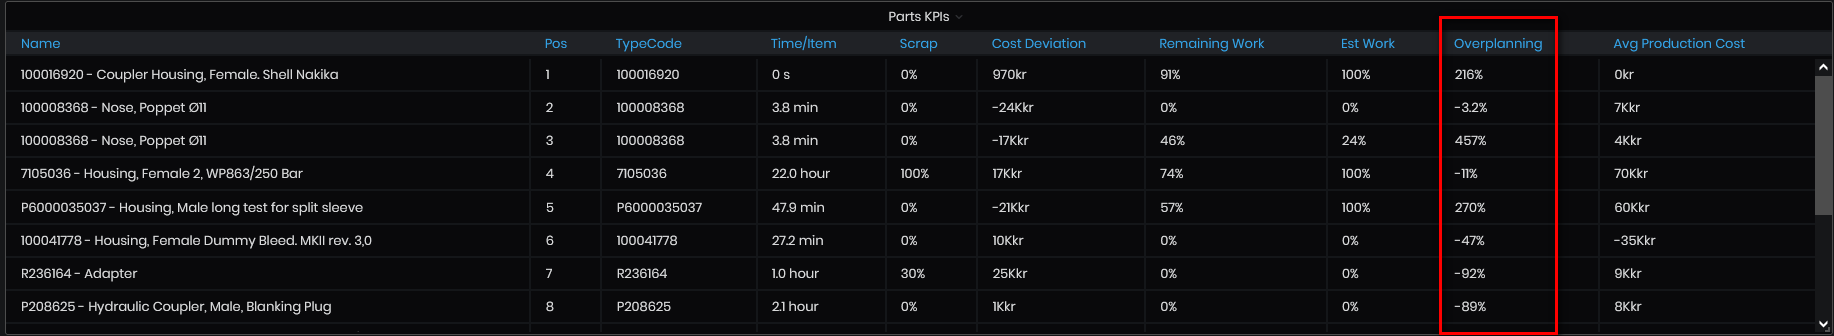
Figure 23: Work Order OEE - Part KPIs - Overplanning%
Calculation:
-
For the selected part calculate the planned time per item:
- TotalPlannedDuration - the planned duration for the part
- OrderedQuantity - the ordered quantity of the part
-
PlannedTimePerItem = TotalPlannedDuration / OrderedQuantity (min)
-
For the selected part item code calculte average production time per item:
- ItemCodeDuration (min) - sum of durations for all work orders
- ItemCodeProducedParts - sum of good and scrap quantities producted for all work orders
-
AverageProductionTimePerItem = ItemCodeDuration / ItemCodeProducedParts (min) See calculation of Average time per item code
OverplanningPerPart = ((PlannedTimePerItem / AverageProductionTimePerItem) * 100) - 100 (%)
Parts Average production cost
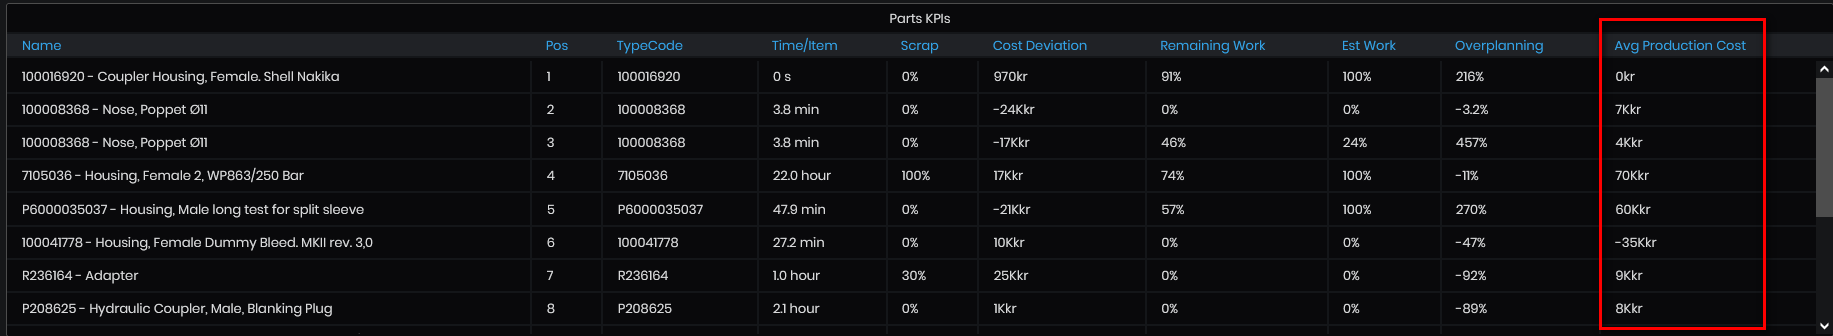
Figure 24: Work Order OEE dashboard - Average Production Cost
This KPI represents the time difference between typical time per item and the current time per item for order part, multiplied by the produced items.
Note: The result is calculated as duration, in hours. However in Grafana this value is multiplied by the “cost per hour” variable to display the KPI value as currency (NOK kr).
Calculation:
- Time per item is calculated per order part. See Time per item calculation
- Average time per item is calculated for part item code. See Average time per item calculation
Average Production Cost = (Total Parts Produced * (Time per Item – Average Time per Item)) * CostPerHour (kr)
OTD per position(part) and OTD per department
The KPI OTD per part represents the difference in days between the actual stop date (or the current date for not closed parts) and the planned stop date for a part. OTD is equal to ‘Y’ when the order has finished before the planned stop date or ‘N’ when there are delays from the planned stop date.
Calculation:
-
Part (ODT)
-
For Open parts OTD is calculated:
OTD = I today’s date -Internal delivery date -
For Closed parts OTD is calculated:
OTD = Actual stop date -Internal delivery date
-
-
Operation (OTD)
-
For Open operations OTD is calculated:
OTD = today’s date- Plan stop date -
For Closed operations OTD is calculated:
OTD = Actual stop date -Plan stop date*Note: Only positive OTD values are updated.
ODT per Position and ODT per Department are presented at the bottom of the Work Order OEE dashboard
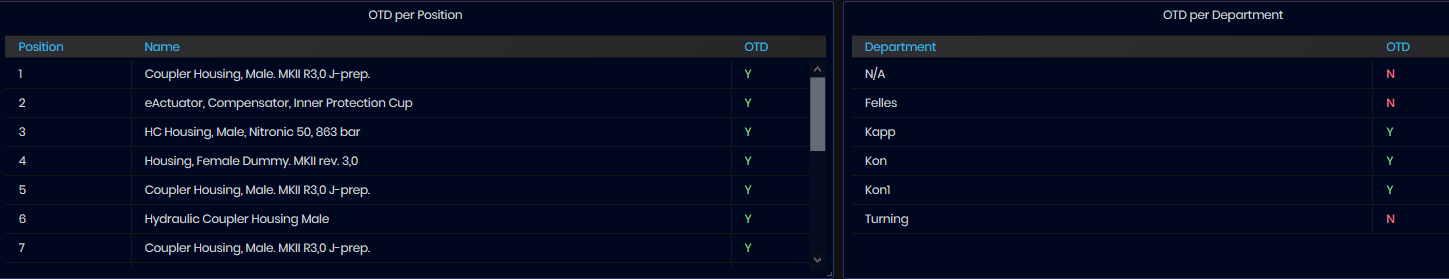
Figure 25: Work Order OEE - OTD per Position, OTD per Department
Average KPIs per ItemCode
Average KPIs are calculated per ItemCode for the selected part.
Average time per item

Figure 26: Work Order OEE dashboard - Average Time per Item
This KPI represents the average time spent per produced item, across all parts with the same ItemCode, in sec/min/hour.
The data needed for this KPI consists of:
- ProductionDurationOfPartsPerItemCode – the sum of production duration of all closed order parts with the same ItemCode.
- TotalPartsProducedPerItemCode – the sum of all produced parts of all closed order parts with the same ItemCode.
Calculation:
AverageTimeItemPerItemCode = ProductionDurationOfPartsPerItemCode / TotalPartsProducedPerItemCode
Average scrap
Average Scrap is calculated per ItemCode. It is possible for different orders to have parts with the same ItemCode.

Figure 27: Work Order OEE dashboard - Average Scrap
The data is based on the order parts with the same item code produced good and scrap quantities. Parts are from different work orders. Only closed order parts are used in the calculation of this KPI.
Calculation:
-
GoodQuantity = sum of all good parts produced by order parts with the same ItemCode number
-
ScrapQuantity = sum of all scrap parts produced by order parts with the same ItemCode number
AveragePercentScrap = ScrapQuantity / (GoodQuantity + ScrapQuantity) * 100 (%)
Part Progress per Operation
For selected part from the filter is а shown chart with operations per part. On mouse over each operation are shown: Operation Name, Ordered Quantity, Min Quantity, OK, Scrap, Progress (%).
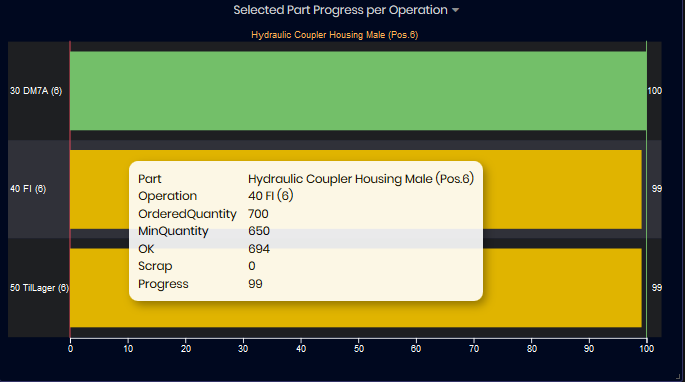
Figure 28: Work Order OEE dashboard - Part progress per operation
Machines Utilization
The utilization of machines used in the operations of the part is presented as а flow chart. The machines are ordered per operations performed. For each machine is shown the percent of work that has been performed by the machine. If one operation is performed on two machines they are grouped vertically. Only when executing quality control (KON) it is always visualized consecutively.
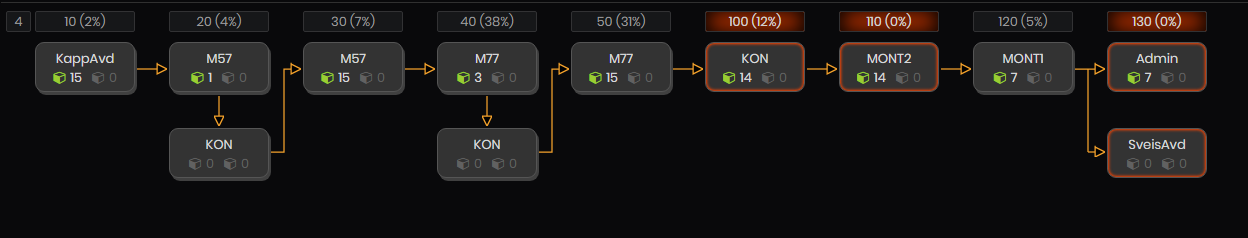
Figure 29: Work Order OEE dashboard - Machine Utilization
Mouse over the machine shows in green and red the number of OK and scrap parts produced by the machine and duration of operation.
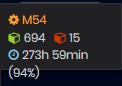
Figure 30: Work Order OEE - Machine Utilization - mouse over the machine
Mouse over the progress shows Planned stop time and actual stop time and ODT (On time delivery) Y/(Checkmark icon when delivery is on time) or N/(Cross icon when there are delays in delivery) and duration of operation.
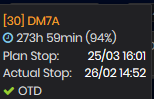
Figure 31: Work Order OEE - Machine Utilization - mouse over the machine progress
Utilization
To open the Utilization dashboard select:
- As a user with role Manager: Main Menu/Manager/Utilization.
- As a user with role Supervisor: Main Menu/Supervisor/Utilization.
- The Utilization dashboard opens.
Utilization is a percentage of time a machine is reporting an active state (counted statuses Active and Producing).
Downtime is a percentage of time a machine is down, reciprocal to utilization. Machine operators is possible to select a downtime reason that could be analyzed.
From the Utilization dashboard, users can see:
- The number of hours machines have been producing during a specific work hour and day.
- The number of hours the machines have been running in each day of the week and month.
- The number of downtime events that have occurred for a department.
- Utilization chart with number of hours worked by machines worked per day by department.
- Utilization chart with a number of hours worked by the machines in the last week.
Using this dashboard supervisors or managers can make analyses about production in the factory. A utilization rate that consistently approaches 100% indicates that you’re overworking your staff, and it may be time to expand. A utilization rate that is consistently low means there isn’t enough work in the pipeline, too many hours are being wasted on non-billable administrative functions, or it might indicate that your company has too many freelancers on projects. Utilization rates that are consistently too high or too low aren’t good for your organization and typically indicate future risks.
When opening the Utilization dashboard and default time interval is “This week so far”
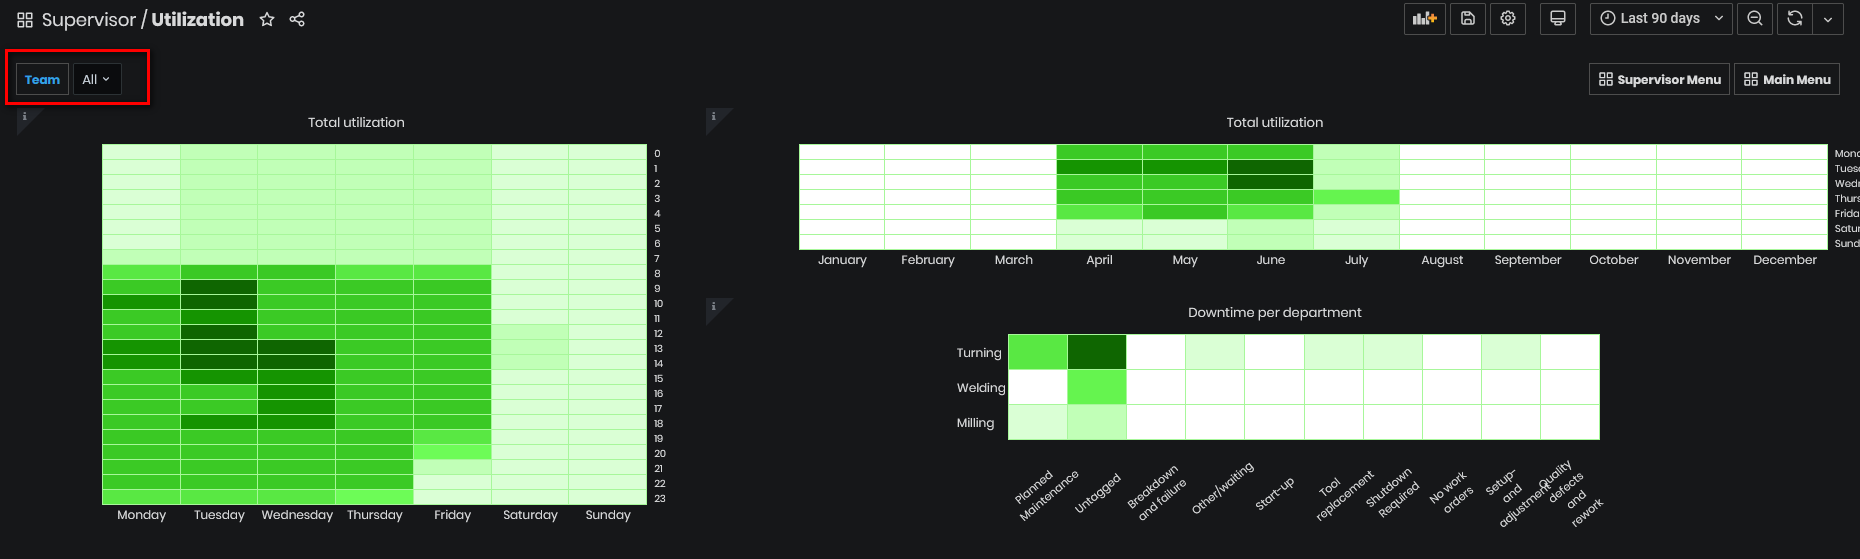
Figure 32: Utilization dashboard
The first heat map, Total Utilization (by day hours and weekdays) presents the number of hours the machines have been producing (counted Active and Production state) during the hours from the day (0-23) and days (Mon-Sun) of the week.
The darkest color block shows the biggest number of machine active hours. The lighest color block shows the lowest number of machine-hours. The user can look at hourly and weekly data simultaneously and make analyses.
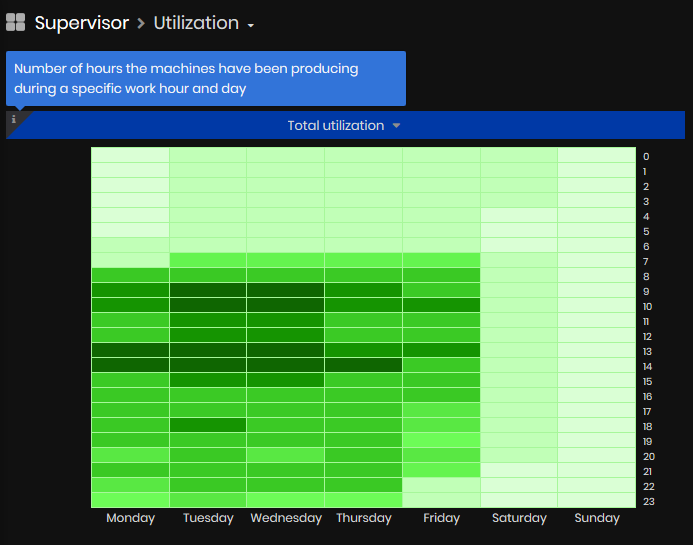
Figure 33: Utilization dashboard - Utilization by hours of day and days of the week
The second heat map chart, Total Utilization (by days of week and months of the year) presents the number of hours the machines have been producing during the days of week and months of the year.
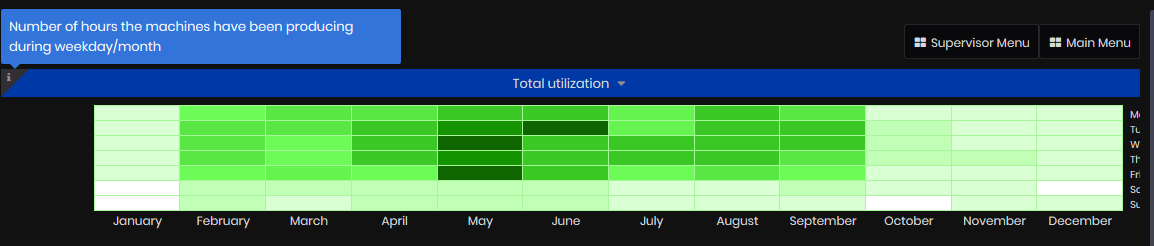
Figure 34: Utilization dashboard - Utilization by days of week and months of year
The 3rd heat map chart presents the number of downtime events per department. For Departments Turning, Milling and Welding user can analyze for which type downtime (related to Man, Machine, Method of work or Materials) there are more events and to do some related actions about production organization.
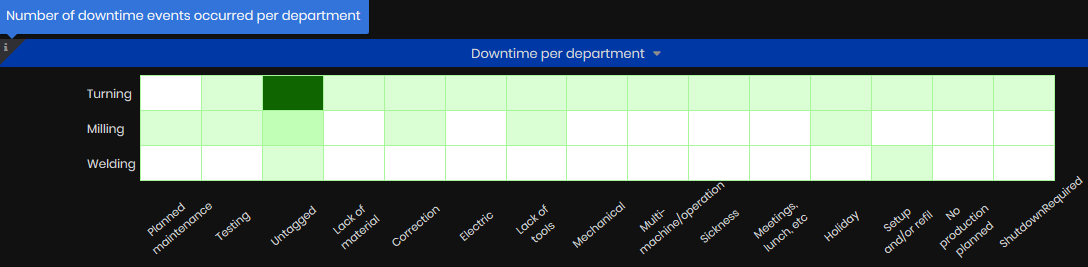
Figure 35: Utilization dashboard - Downtime events per department
Heatmap charts can be filtered by Team(s), selected from the team's list.
The next Utilization chart presents aggregated hours of active machines per day during the selected time period (counted statuses Active and Producing).
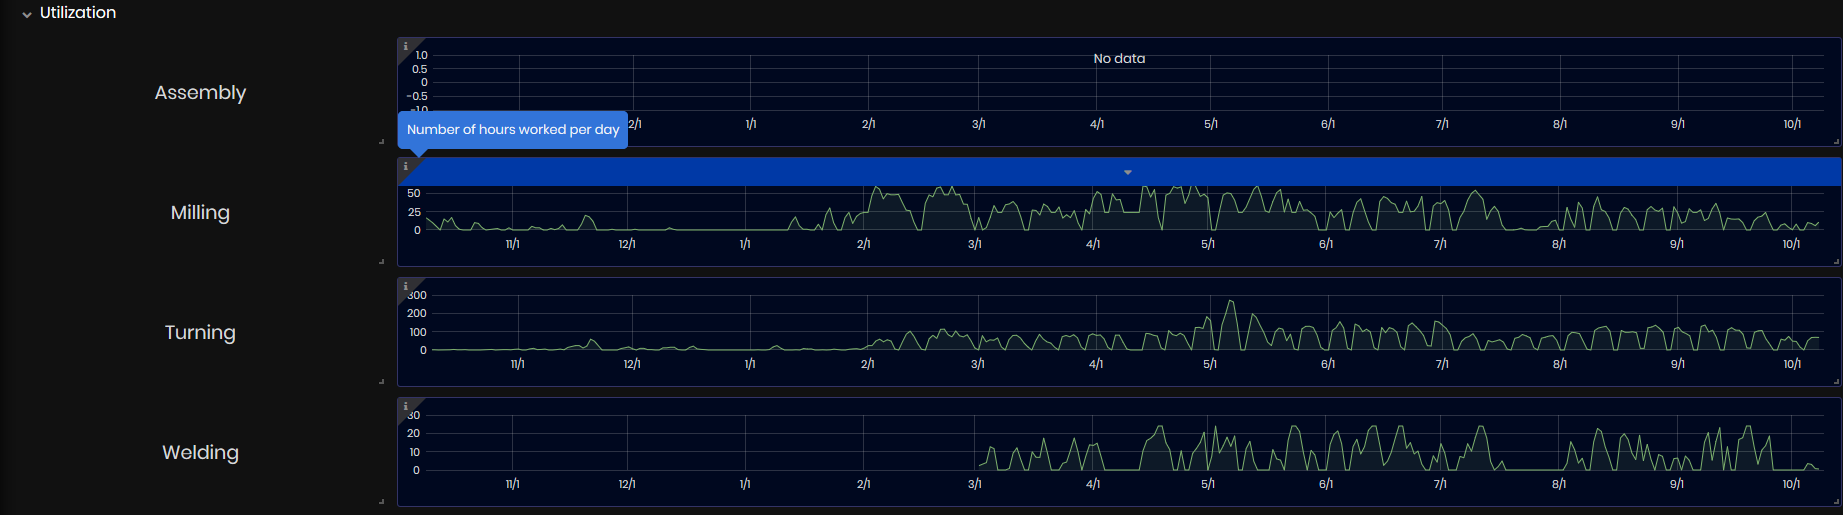
Figure 36: Utilization dashboard - Aggregated hours of active machines per day
The Utilization (week) shows the number of active machines working at the same time per hour.
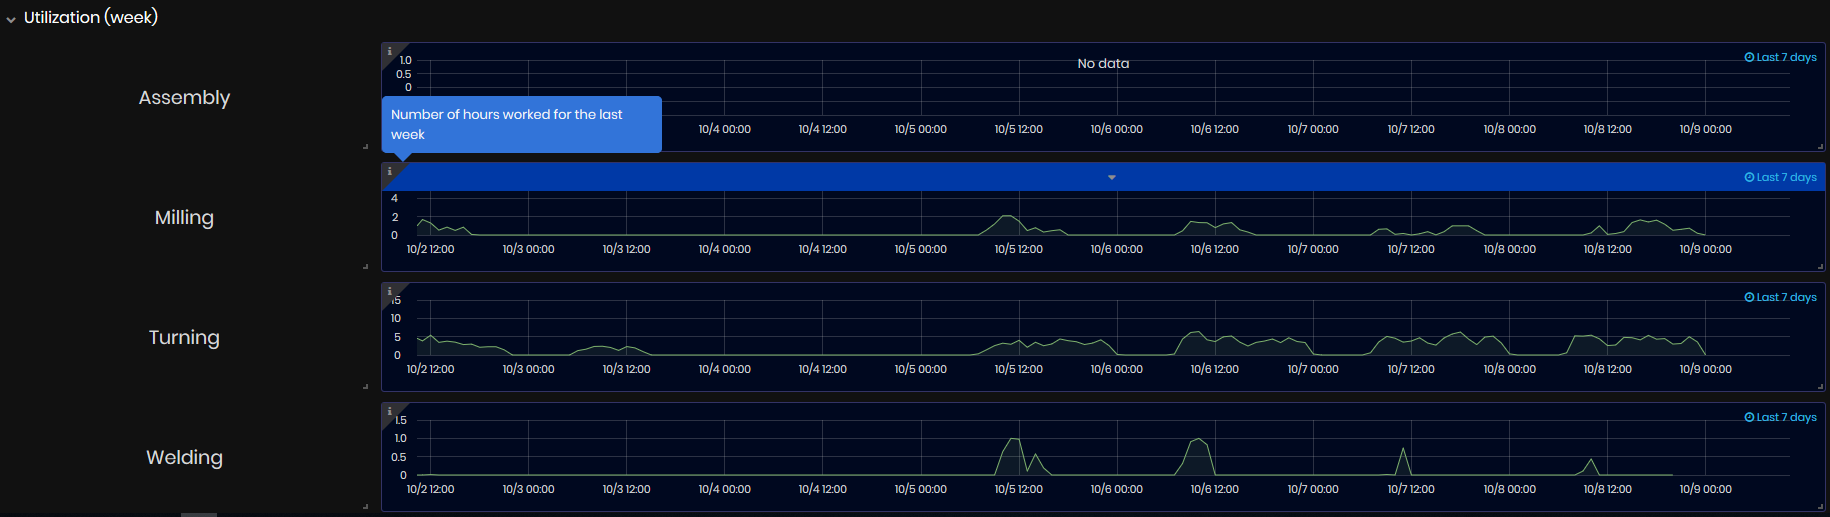
Figure 37: Utilization dashboard - number of active machines working at the same time per hour
Facility
To open the Facility dashboard select:
- As a user with role Supervisor: Main Menu/Supervisor/Facility.
- The Facility dashboard opens.
Purpose: The Facility dashboard displays information for various facilities e.g. environment, pump, water temperature, power, vibrations, etc. Data is obtained from sensors attached to assets or machines.
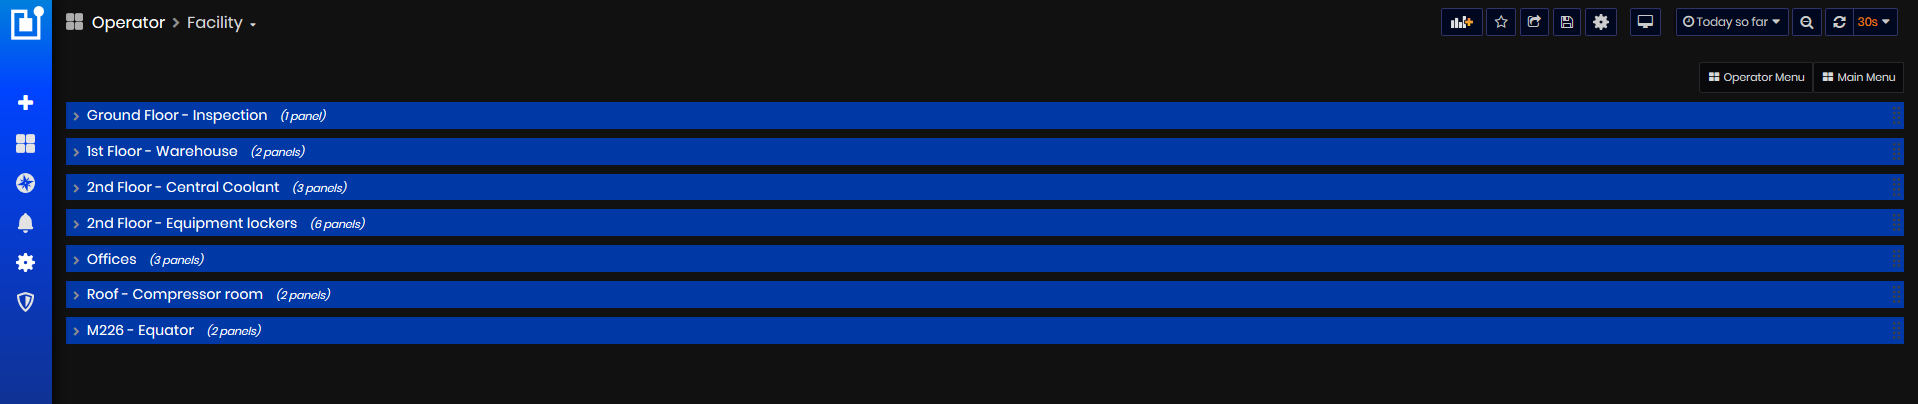
Figure 38: Facility dashboard
For details on charts with external sensors, go to External Sensors dashboard.
Machine sensors
Different types of sensors can be connected to the equipment.
Data is received from the configured sensors or type: ReMoni, Disruptive Technology, NCD, Neuron sensors, El-watch, or NCD.
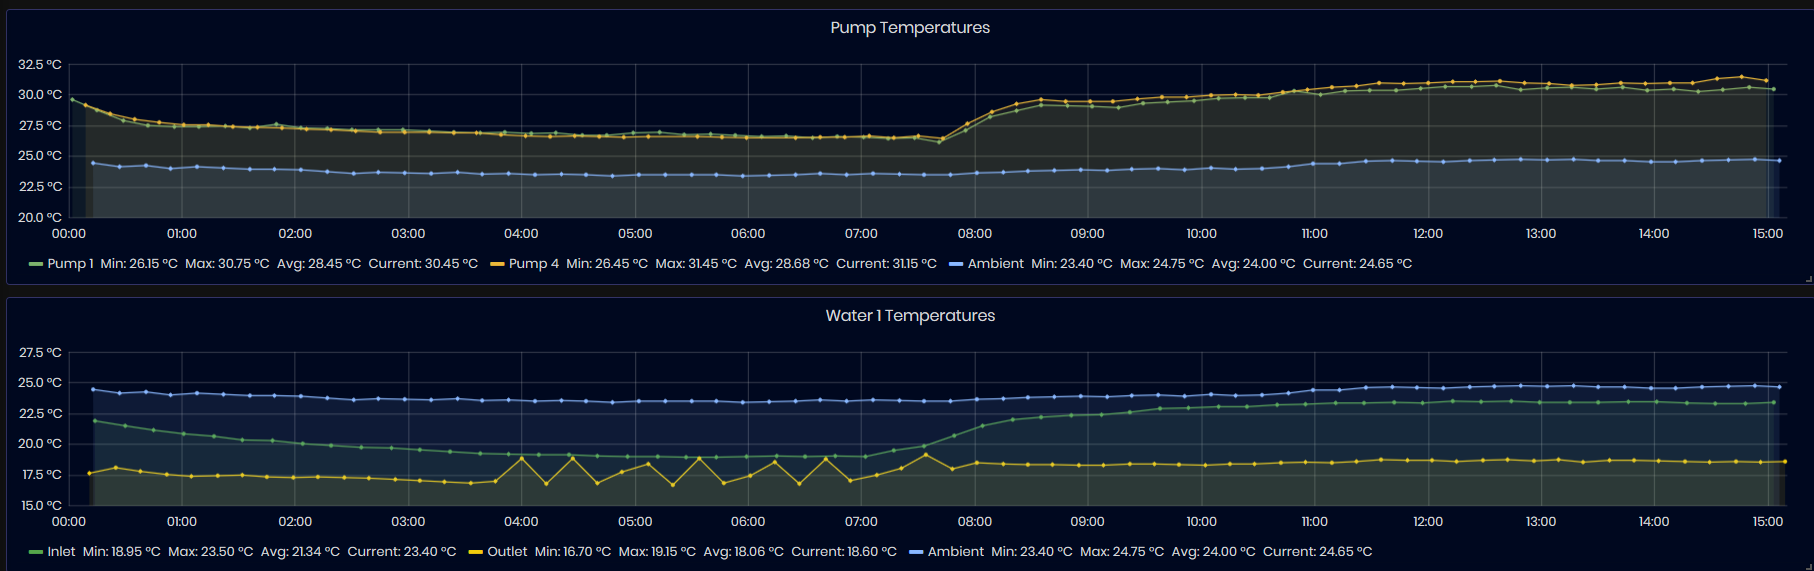
Figure 39: Facility dashboard - Pump and water temperatures
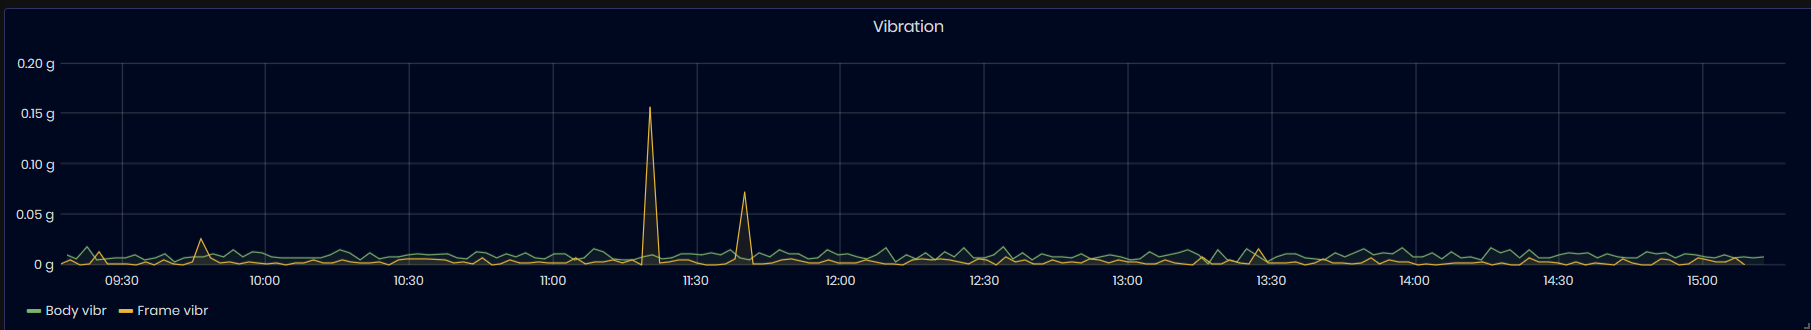
Figure 40: Facility dashboard - air temperature and motor temperature
For details on tag configuration with an external sensor, go to Create tags with external sensors
Equipment lockers
There are shown temperature and humidity for locker1 and locker2. There is also a graphic for Temperature and Humidity over time. The time period can be changed.
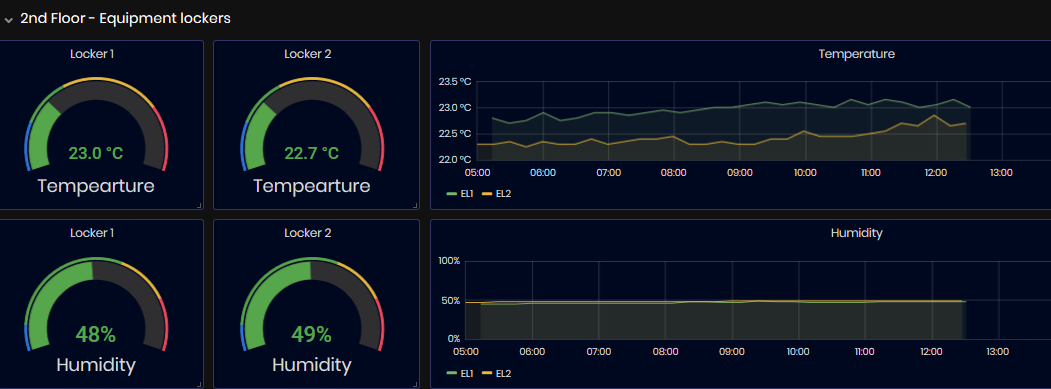
Figure 41: Facility dashboard - equipment lockers parameters
Offices
Expand the panel Offices. The panel shows graphics with temperatures in the offices during the selected time period.
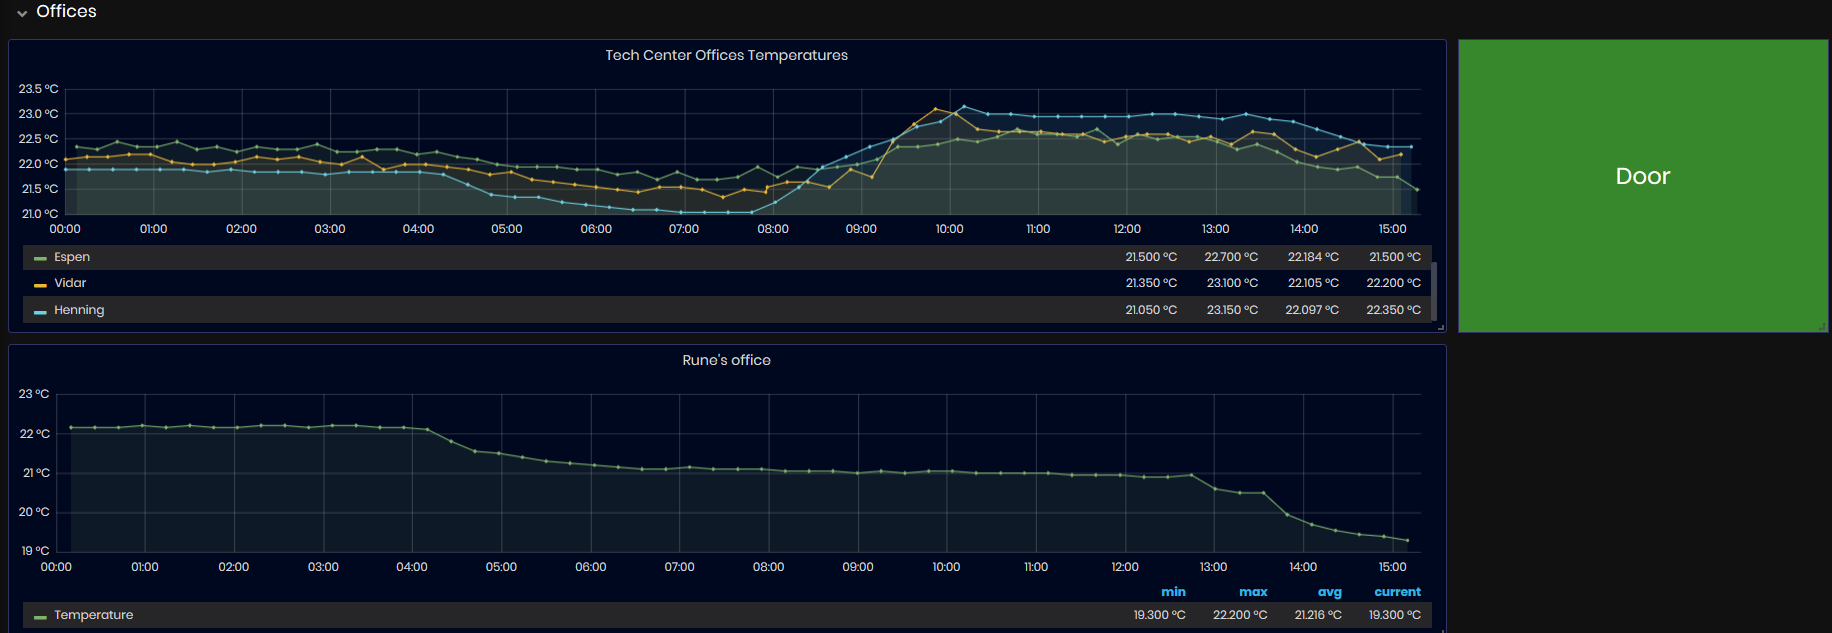
Figure 42: Facility dashboard - offices temperature
For each office, is shown graphic with temperature values for the selected time period. Also are displayed the average value and the current value.
Sensors in all offices are usually of type Disruptive Technologies.
For details on tag configuration with an external sensor, go to Create tags with external sensors
Weather
To open the Weather dashboard select:
- As a user with role Supervisor: Main Menu/Supervisor/Weather.
- The Weather dashboard opens.
Purpose: The Weather dashboard displays information about the weather in a selected city: Temperature, Wind Speed, Wind Direction, Daily Temperature histogram, Daily Wind Speed Histogram, Daily Wind Direction Histogram. The time period can be changed from the preset periods.
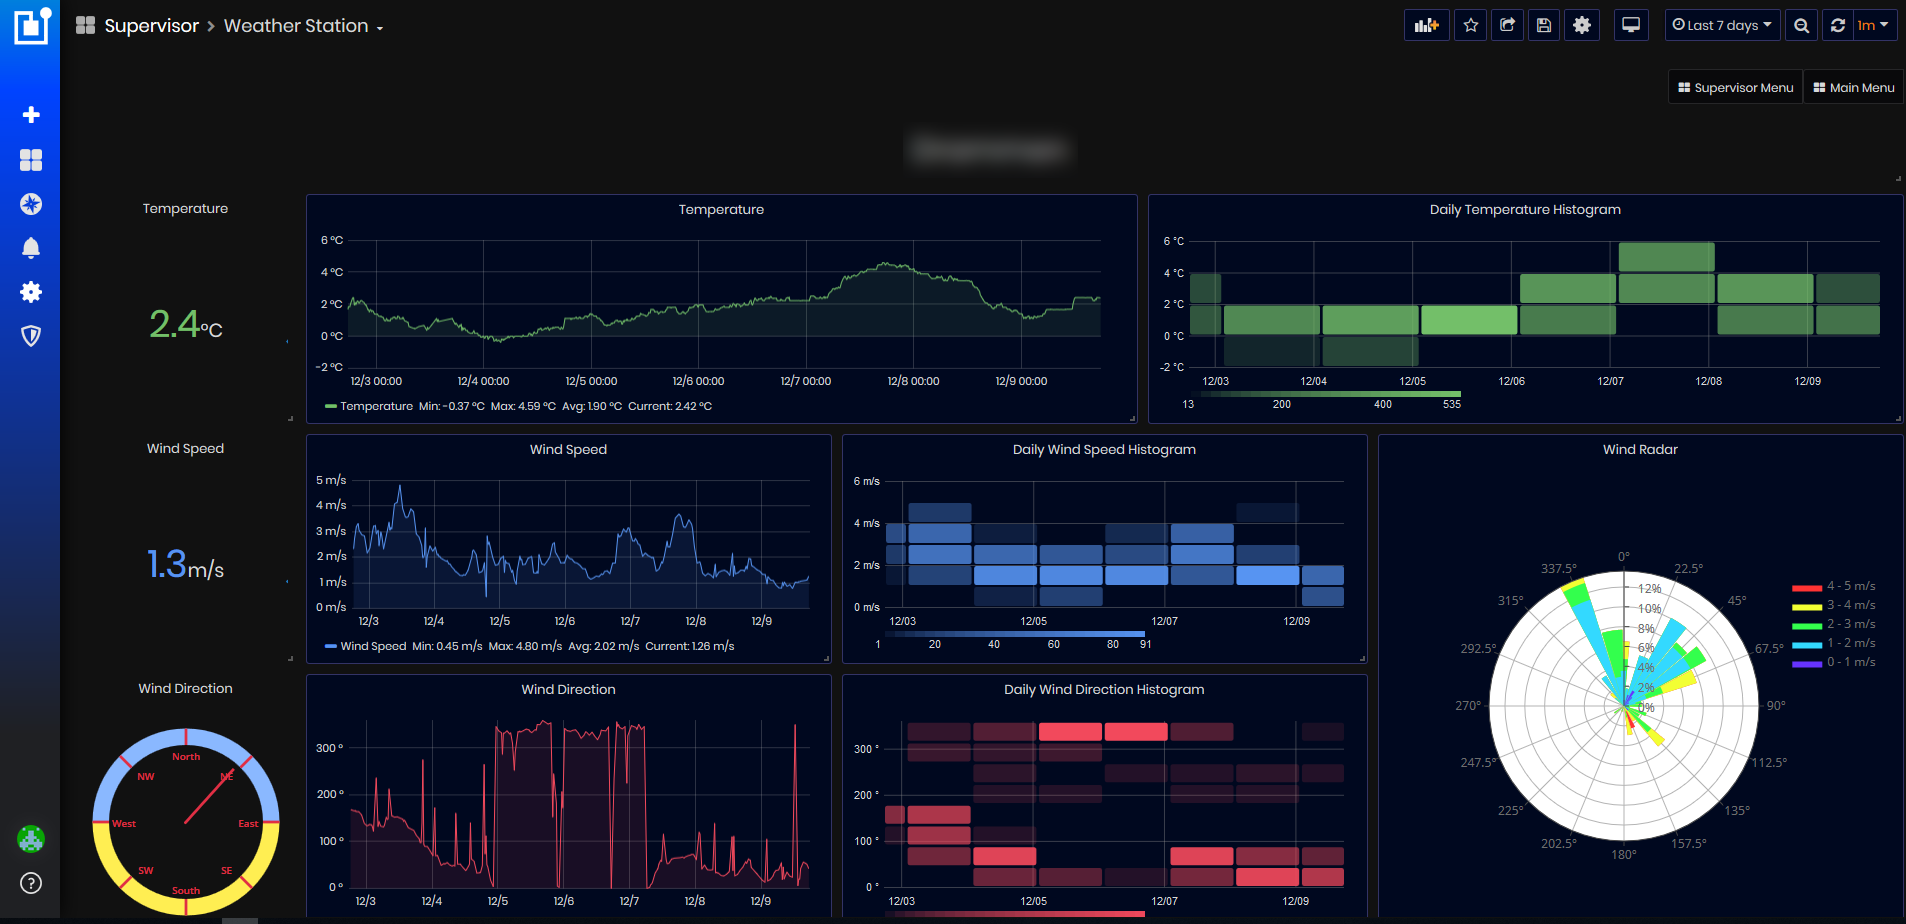
Figure 43: Weather dashboard - Weather station
Temperature and Daily Temperature Histogram
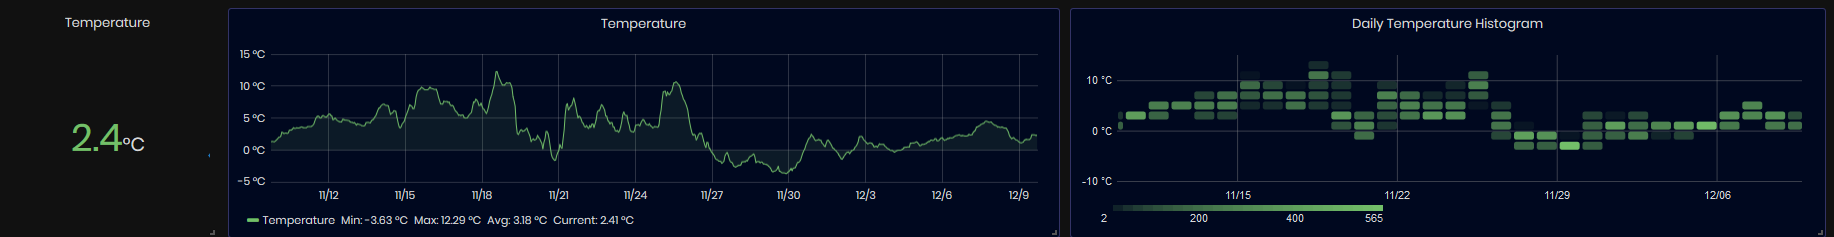
Figure 44: Weather dashboard - Temperature chart and daily temperature histogram
Wind Speed and Daily Wind Speed Histogram
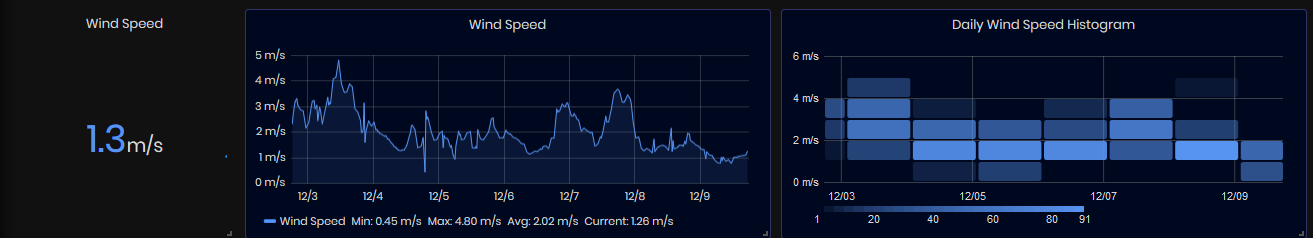
Figure 45: Weather dashboard - Wind speed and Daily wind speed histogram
Wind direction and Daily wind direction histogram
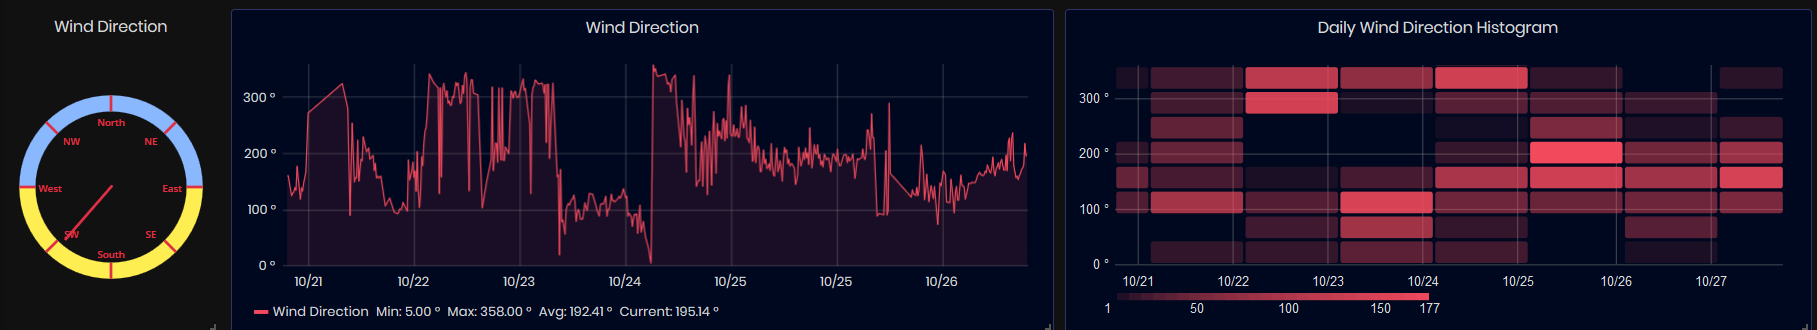
Figure 46: Weather dashboard - Wind direction and Daily wind direction histogram
Wind Radar
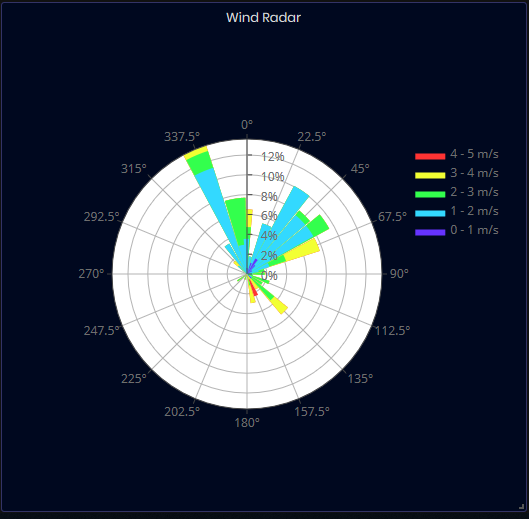
Figure 47: Weather dashboard - Wind Radar
Register Progress
To open the Register progress dashboard select:
- Supervisor/Register Progress
- The Register progress dashboard opens.
Purpose: The Register progress dashboard displays information about work orders per machine, their position, operation, parts, start and end dates of the order, good and scrap quantity. Information is imported from system SAPB1 (SAP Business 1) and visualized.
Using this dashboard, users can filter and get information about:
- All machine work orders, good and scrap quantity of parts produced.
- Start and end dates of the orders per machine.
- Part name, positions, and operations of the orders.
- If orders are closed - Information is extracted by filtering or entering the barcode
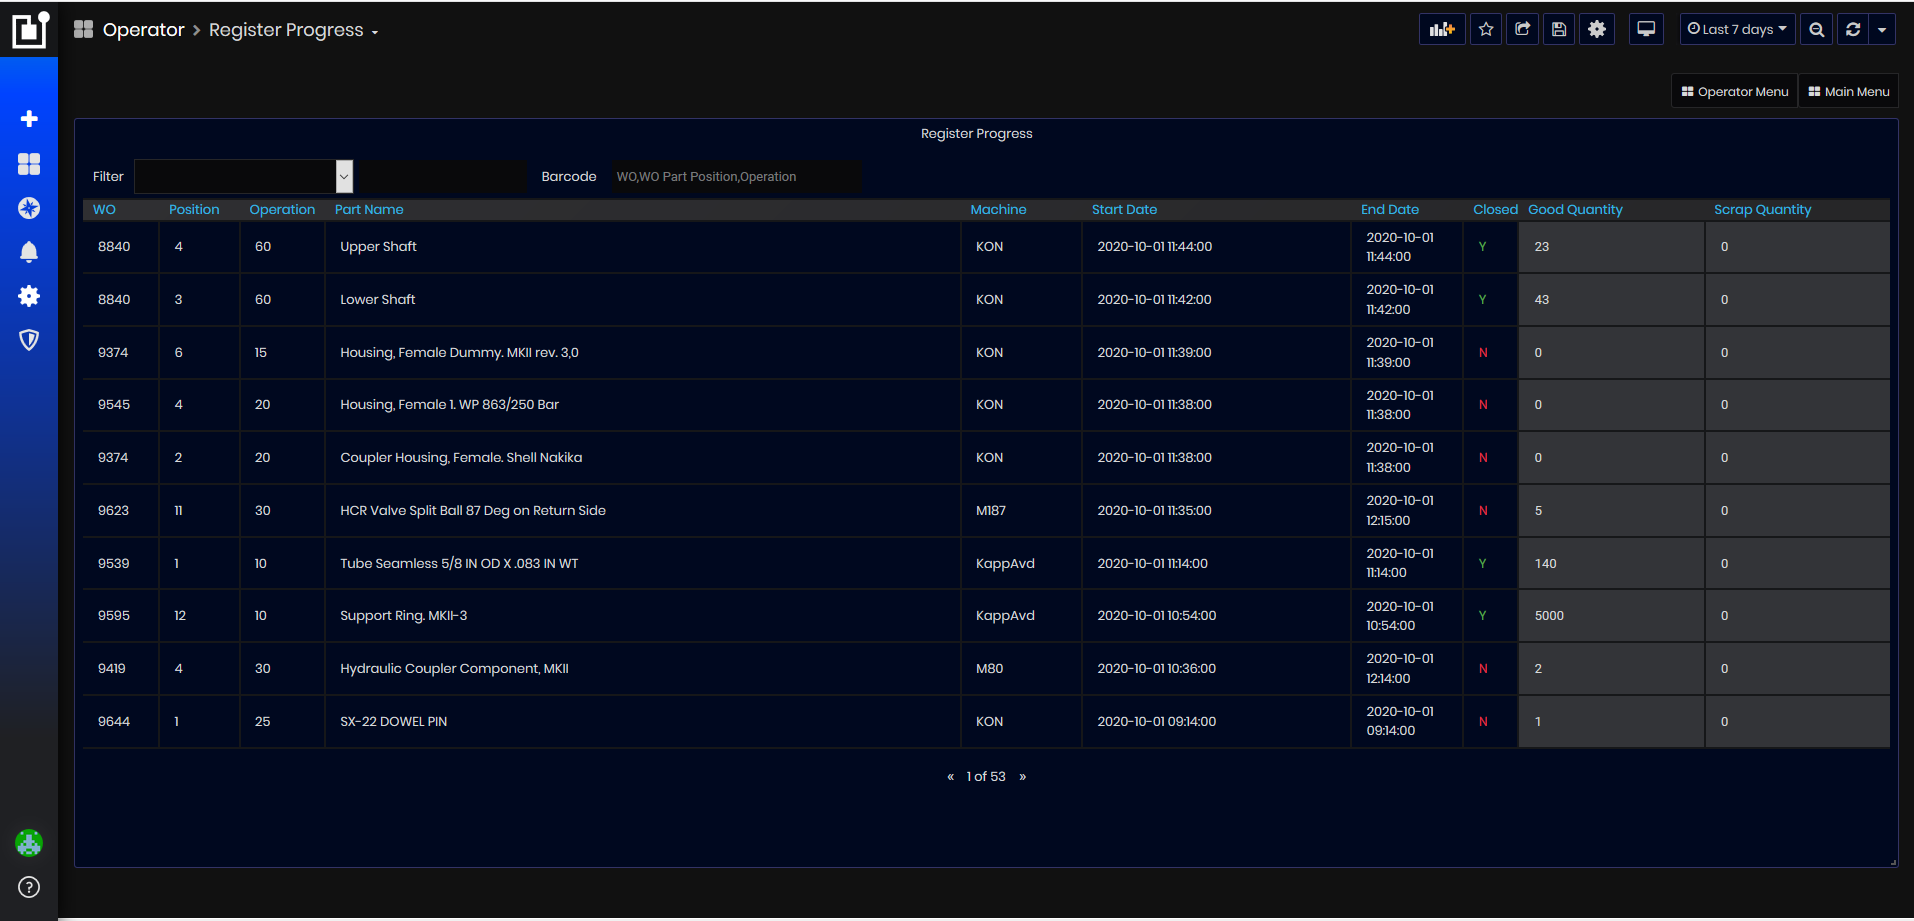
Figure 48: Register Progress dashboard
Dashboard displays in a table the list of work orders. For each order are shown:
- Order number
- Position, Operation, Part Name - produced by the order
- Machine - machine executed the work order
- Start Date, End Date - start and end date of the order execution
- Closed - Y/N – if the order is closed or not
- Good Quantity - the number of good parts produced
- Scrap Quantity - the number of scrap parts produced
Information for work orders can be filtered by selecting the following filters:
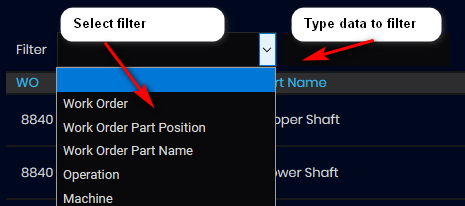
Figure 49: Register Progress dashboard - Filters
- Work Order and type part of the work order number
- Work Order Part Position and type the value
- Work Order Part Name and type the part of the Part Name
- Operation and type the number of operation
- Machine and type the number of machine
Filtering is possible by entering a barcode in the following format.
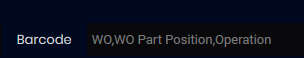
Figure 50: Register Progress dashboard - Filtering by barcode
- The filtered work order is listed