Factory Layout 3D
To open тhe Factory Layout dashboard select:
- Main menu/Factory Layout
- The Factory Layout Dashboard opens.
Purpose: Factory Layout presents a 3D picture of the factory buildings and machines on each floor.
From the Factory Layout dashboard, users can see:
- The real location of the machines in the buildings in 3D reality.
- By hovering over the machine, you can see the machine's OEE percentage.
- On mouse over the machine you can see the machine work order and parts, parts progress.
- A rotating icon with an exclamation mark is displayed above the machine with alarms in the selected time period .
- A rotating wrench is displayed above the machine with maintenance and option Shutdown Required during the selected time period.
- Users can filter machines by departments or teams.
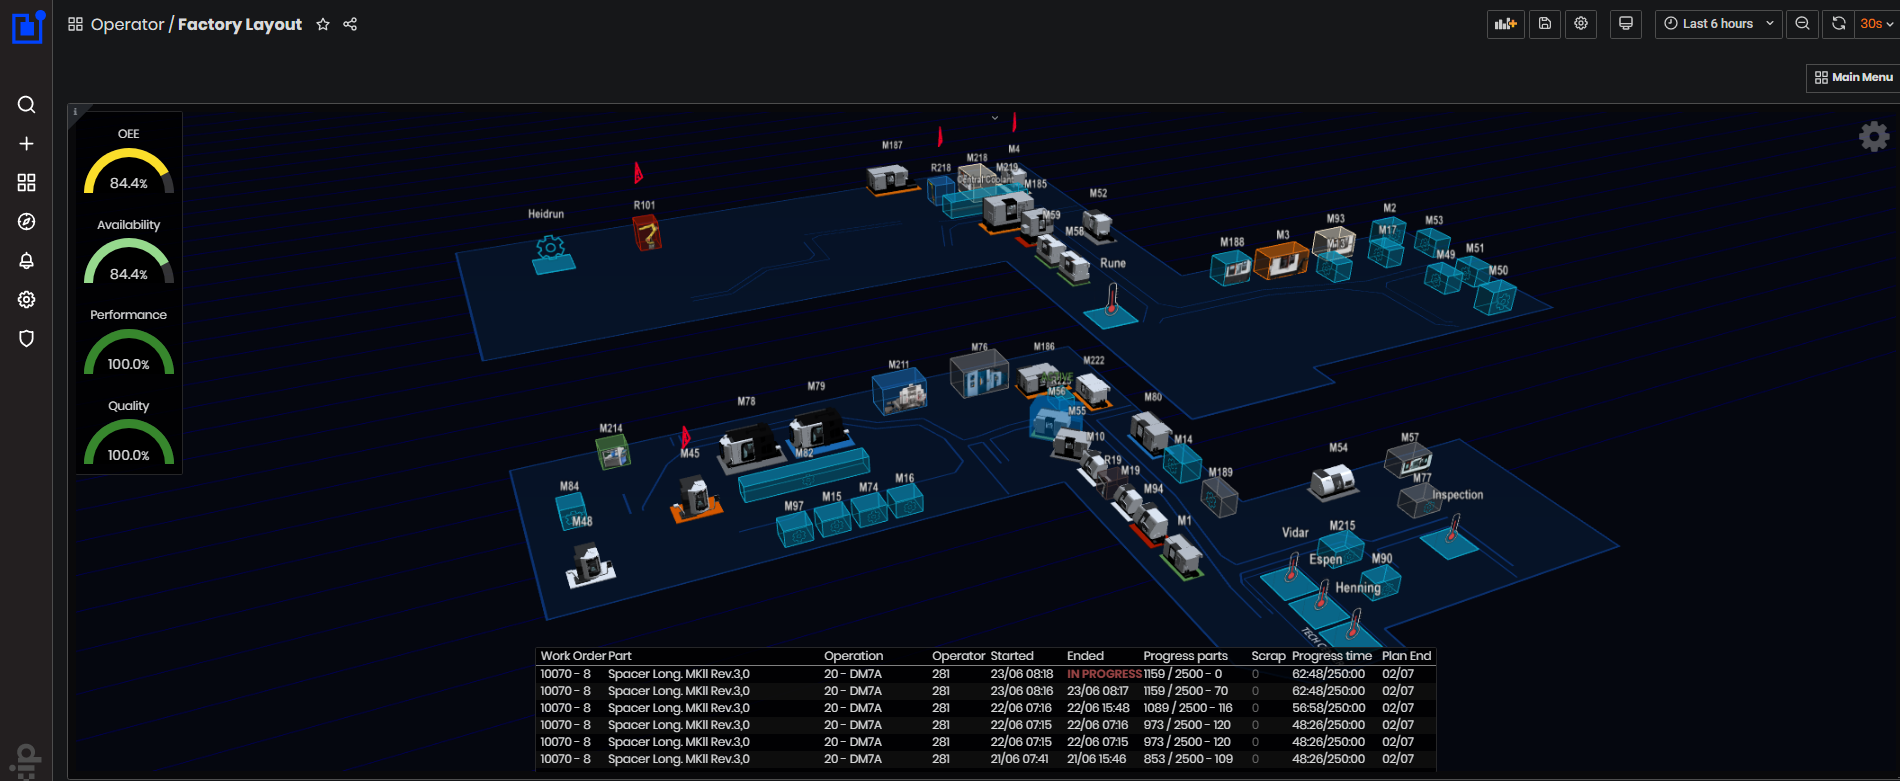
Figure 1: Factory Layout dashboard
The Factory layout is configured in Upkip Administration module. To Factory layout configuration
Different tag values can be visualized on the machine in a 3D factory layout.

Figure 2: Factory Layout dashboard
Machine Details
Machine OEE
On mouse over the machine on the left shows the machine's OEE (%) and related percentages of Availability, Performance, and Quality for the selected time period. For details on machine OEE Go To Machine OEE dashboard
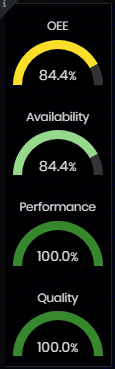
Figure 3: Factory Layout dashboard - Machine OEE
Machine work orders
Hovering over the machine displays a table with machine orders information for the selected time period. The information in the table is:
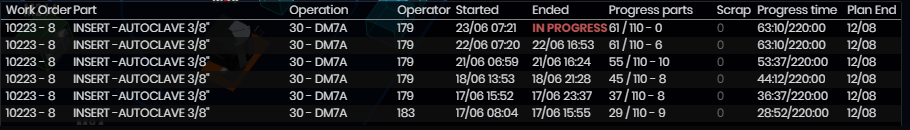
Figure 4: Factory Layout dashboard - Machine work orders
-
Work Order - <work order number>-<part number>
-
Part - part name
-
Operation - operation name
-
Operator - operator number
-
Started -Actual start day and time for part operation
-
Ended -Actual end day and time for the part operation. One part operation can continue many days.
-
Progress pars -A/B – C, where:
- ‘A’ is the total produced accumulated in the current day.
- ‘B’ is the total planned for operation
- ‘C’ is produced in the current day
-
Scrap - scrap produced. Scrap total is accumulated from previous operations/days
-
Progress time -<actual time>accumulated/<planned time>
-
Plan End - day/month
For details about machine work orders, go to Order OEE dashboard,. Enter the order number and view the orders and parts KPIs.
Machine maintenance order
Hovering over the machine under maintenance will display the table with machine maintenance orders for the selected time period.

Figure 5: Factory Layout dashboard - Maintenance order
The machine maintenance order line displays the information: Shutdown Required, Work order number from the MMS, Short description, Description, Planned start, and end date.
A spinning wrench icon is displayed above machines with a maintenance order in the currently selected time period. The base of the machines under scheduled maintenance is colored orange.
Clicking on the machine
Clicking on the machine (if supported by the Upkip platform) opens a new page Machine detailed dashboard.
Active machine
Active machines in the Factory Layout are colored green.
Stopped machine
Stopped machines in the Factory Layout are colored red.
Machines with Alarms
Рotating exclamation marks are displayed above active machines with alarms.
Room Parameters
Offices
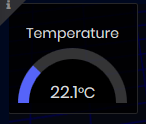
Figure 6: Factory Layout dashboard - Office temperature
On mouse over the offices, the temperature in the office is displayed at the upper left.
Clicking on the office icon opens the Facility dashboard.
Central Coolant
On mouse over the central coolant, the temperatures for pumps and ambient temperature are displayed at the upper left.
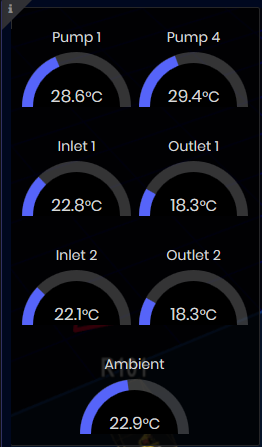
Figure 7: Factory Layout dashboard - pumps and ambient temperatures
Clicking the Central Coolant in the Factory Layout opens a new page Facility Dashboard -Central Coolant
Filtering by department or team
It is possible to filter by department. When you hover the right icon (rake wheel), a list of departments is displayed. If you select a department of the list, only machines from that department are diplayed on the layout.
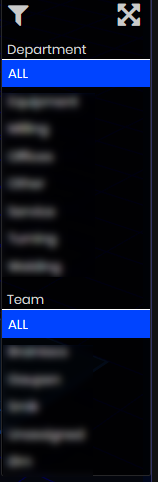
Figure 8: Factory Layout - filtering by department or team
Factory Layout 2D
To open тhe Factory Layout 2D dashboard select:
- Main menu/Factory Layout 2D
- The Factory Layout 2D dashboard opens.
Purpose: The Factory layout 2D presents a 2D image of the factory floors with machines.

Figure 9: Factory Layout 2D
The machine ID is displayed above the machine image. Machine utilization and energy consumption are displayed on the machine. When you mouse over the machine in the upper left, they are also displayed.
When the machine has active alarms, a rotating exclamation mark is displayed on the image. Temperature and other parameters can also be displayed.

Figure 10: Machines with active alarms