Operator Menu
Click the Operator button from the main menu.
- The Operator dashboards menu opens.
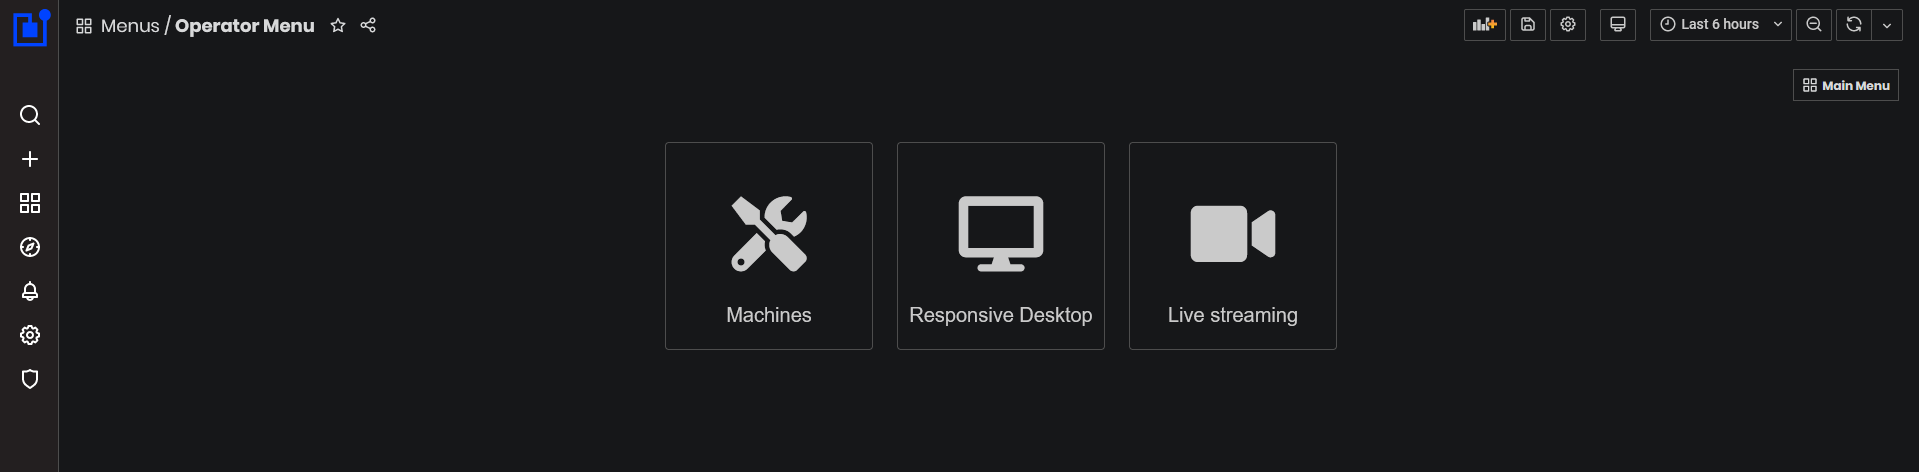
Figure 1: Operator Dashboards
Click the Responsible Desktop button from the menu.
- The Responsible Desktop dashboards menu opens.
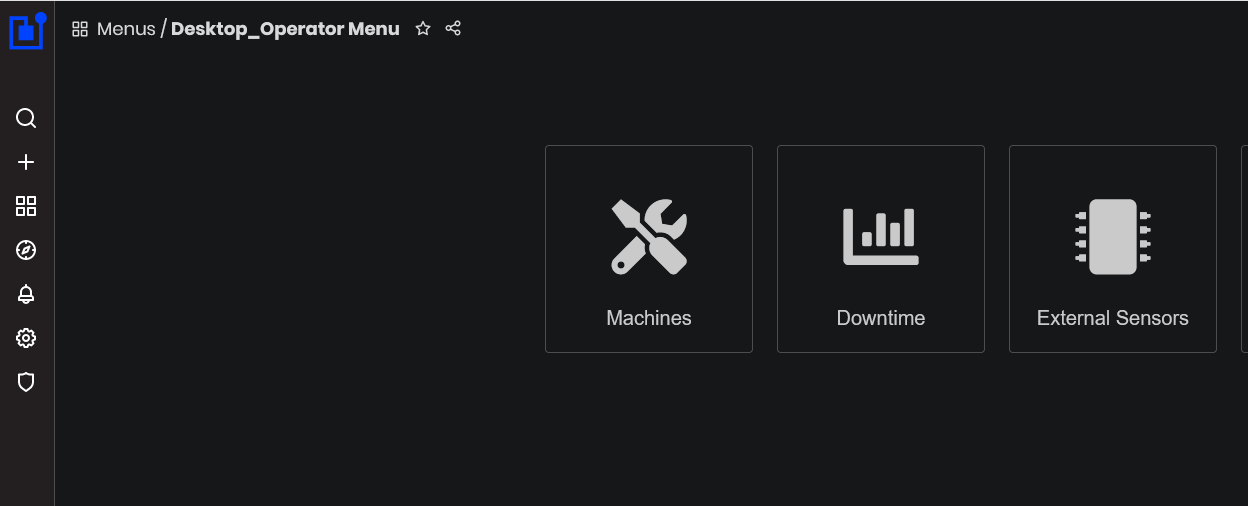
Figure 2: Operator - Responsive desktop dashboards
Machines
To open Machines dashboard with full information, select:
- As a user with Operator role: Operator/Responsive Desktop/Machines
- As a user with Team Leader role: Team Leader/Responsive Desktop
- Machines Summary dashboard opens with full information.
The same roles can open the mobile version (light information) of the machines dashboard that is developed for tablet devices.
To open Machines dashboard on tablets, select:
- As a user with Operator role: Operator/Machines
- As a user with role Team Leader: Team Leader/Machines
- Machines Summary dashboard for tablets opens.
For details, go to Machines Summary Dashboard.
Downtime
Purpose: The Downtime dashboard displays downtime information for all machines in the enterprise for the selected time period.
Precondition: To open the Downtime dashboard, select:
- As a user with role Operator: Operator/Responsive Desktop/Downtime
- As a user with role Team Leader: Team Leader/Downtime
- The Downtime dashboard opens.
From this dashboard, users can see for the selected time period:
- Machines downtime statuses in the enterprise.
- Machine downtime is represented by yellow color called Untagged. The time duration and time percentage are also visible.
Downtime: All-time where the manufacturing process was intended to be running but was not due to Unplanned Stops (e.g. breakdowns), or Planned Stops (e.g.changeovers). Downtime is also called Stop Time.
These unplanned stops are subject to downtime tagging and statistics on downtime tagging times and reasons. They are subject to reports and root cause analysis. Analysis over downtime tagging aids identification of reasons for stop time and supports decision making for addressing issues.
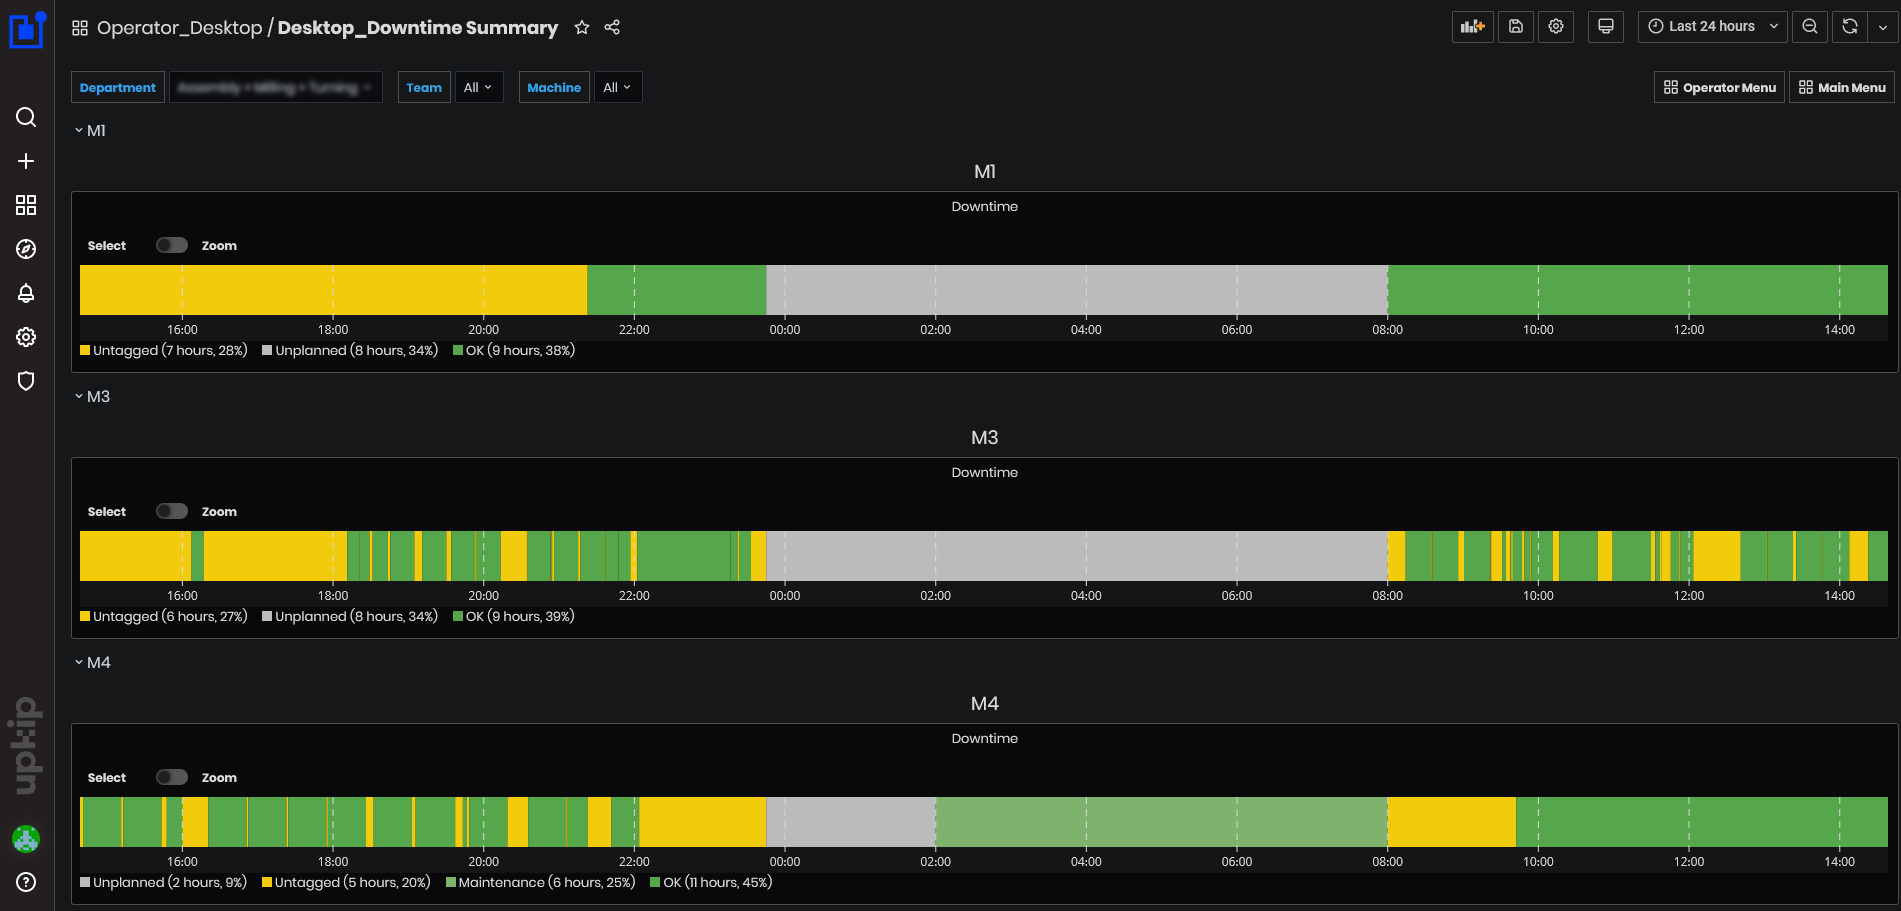
Figure 3: Downtime dashboard
- Machines on the dashboard can be filtered by department, team, or machine(s).
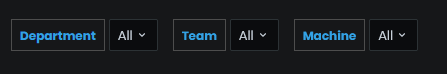
Figure 4: Downtime dashboard filters
Custom time range could be changed by selecting intervals from the predefined periods.
- After changing the period, the chart shows the machine downtime for the period.
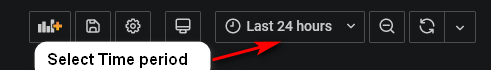
Figure 5: Select time period
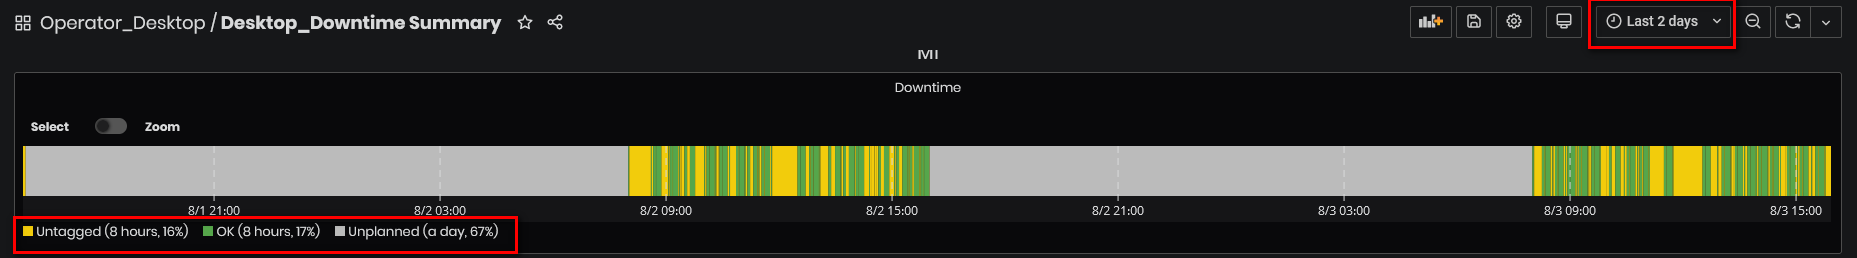
Figure 6: Downtime chart for machine for the selected period
Downtime period types are colored with different colors and could be: unplanned, untagged, and OK. Under the graphics are shown total duration in hours and percentage of the selected time period.
-
Unplanned (grey) - The time when the machine was not planned to produce, according to the shift calendar. For more details about the shift calendar, refer to the Planned Production Time section. Unplanned time is any time out of the shift or during breaks.
-
Untagged (yellow) - A period that is subject to tagging with a downtime reason by the system operator who is responsible to provide an explanation up the chain on the reason why the machine has not been producing in a period when it has been planned to. A low level of production time would mean a high level of downtime, which could be explained by analyzing the top downtime reasons.
-
The downtime tagging reasons are grouped into 4 groups:
-
Man
- Meetings, break, lunch
- Sickness
- Multi-machine operation
- Holiday
- No production planned
-
Machine
- Electric issues
- Mechanical issues
-
Method
- Setup and/or refill
- Planned maintenance
- Testing
- Correction
-
Material
-
Lack of material
-
Lack of tools
If the user clicks on some Untagged (yellow) period is opened Downtime tagging form to select downtime reason for the whole period (Range Full is selected and From-To are loaded with the date-times for the period and cannot be edited).
If the user selects option Custom in the Downtime tagging form, the user can change dates and times in the From-To fields and enter a custom period by using date and time pickers.
-
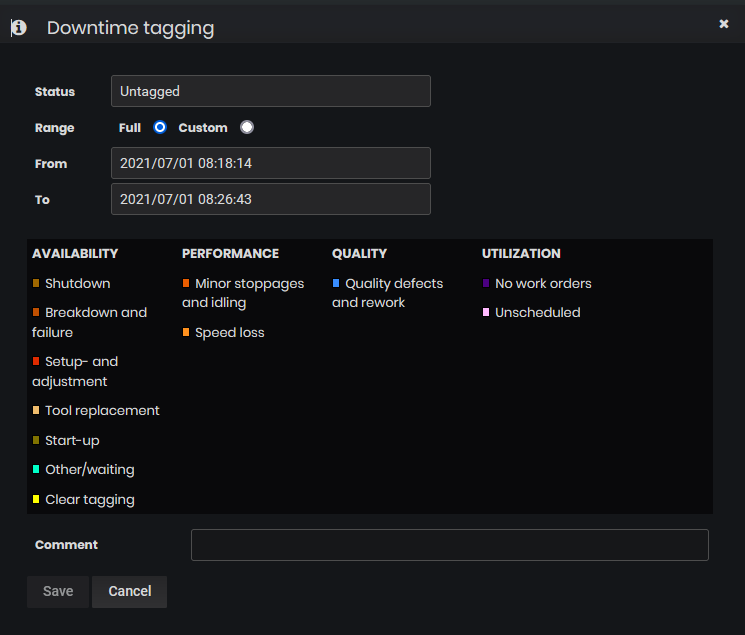
Figure 7: Select downtime reason for status Untagged
-
OK (green) - A period that is not considered as downtime and typically originates from the following machine statuses:
- Active – the machine is running NC program and doing valuable work
- Machine offline - There is no connection (ICMP ping) to the machine controller. Usually, this is either due to network-related problems within the manufacturing network, or the machine has been stopped.
- Machine online – The status appears after a Machine offline status. There is a connection (ICMP ping) to the machine controller, which connection has been restored recently, but status information has not been received after that moment. In this case, the last state in the system could be outdated and hence unreliable.
- System Offline – There is no heartbeat from a major related system component. The system cannot collect or transport data from the machine to the platform backend. The system malfunction could be either on the gateway, the platform backend, or the Internet connection to the cloud. In case the malfunction is outside the on-premises gateway, data from the machine will be collected and submitted to the cloud as soon as the connection is restored.
- System Online – The status appears after a System Offline status. There is a heartbeat from all relevant system modules but no status information after that. Hence the machine status information is unreliable as it may have changed during the offline period.
- Active – the machine is running NC program and doing valuable work
Click here for more details on how to manage downtime reasons.
External Sensors
To open the External sensors dashboard, select:
- As a user with role Operator: Main MenuOperator/Responsive Desktop/External sensors
- External sensors dashboard is opened.
This dashboard shows charts of various sensors connected to machines or next to office premises.
The supported sensor types are: Disruptive Technologies, ReMoni ReCalc, Neuron sensors (Wl-Watch), NCD sensors, OpenWeatherMap.
For details on how to configure external sensors go to External sensors setup.
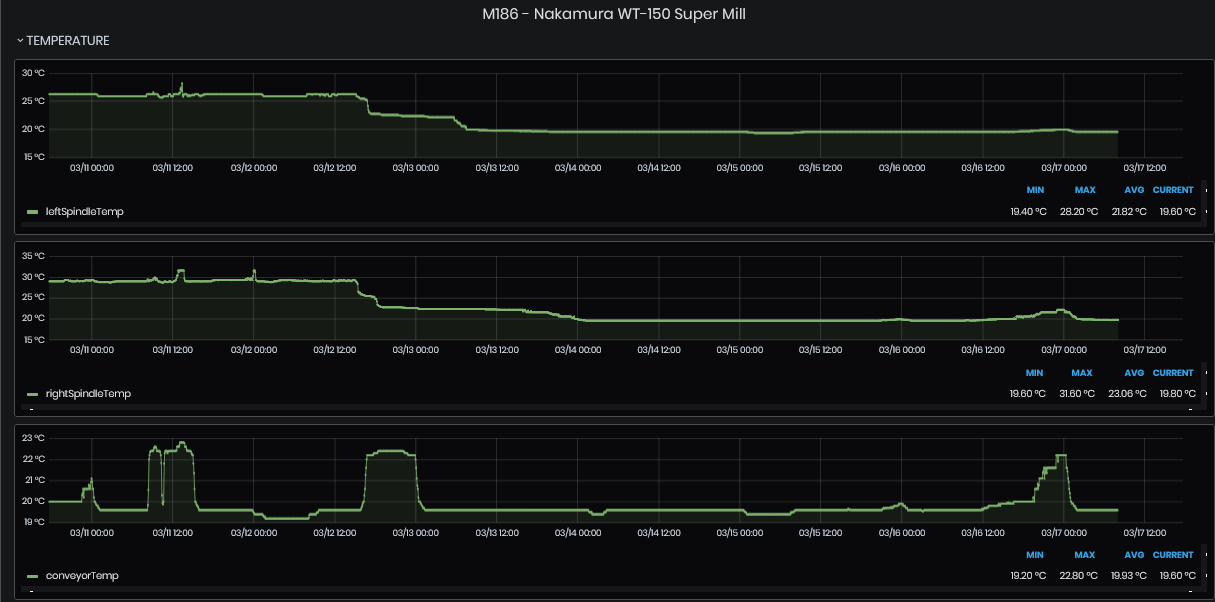
Figure 8: Chart with various temperatures over time
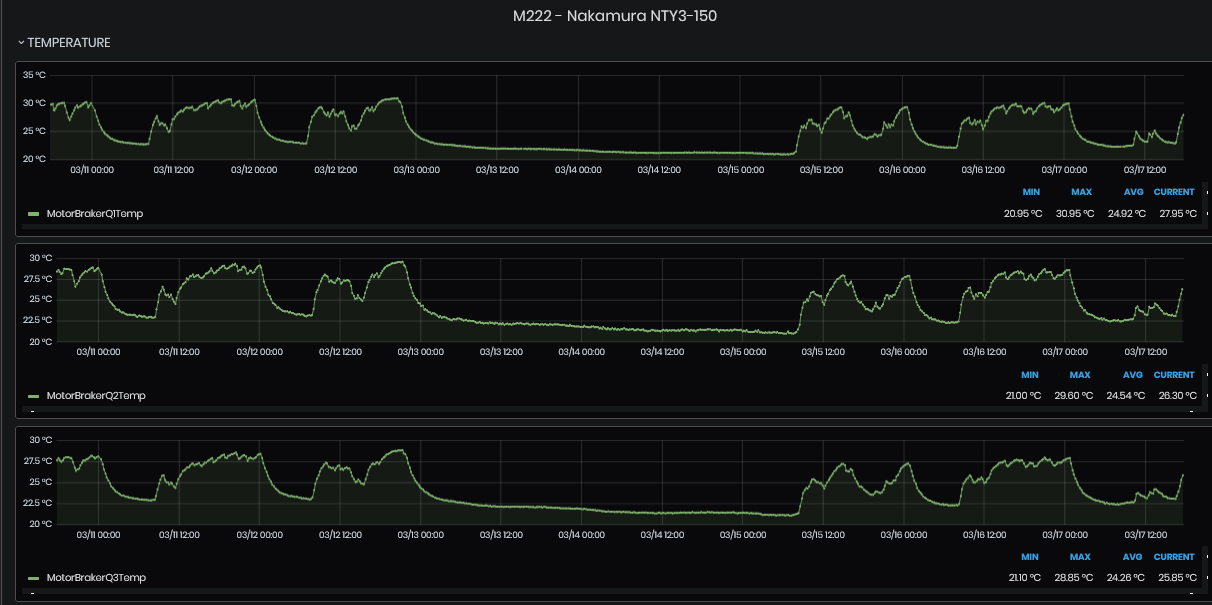
Figure 9: Chart with various temperatures of machine over time
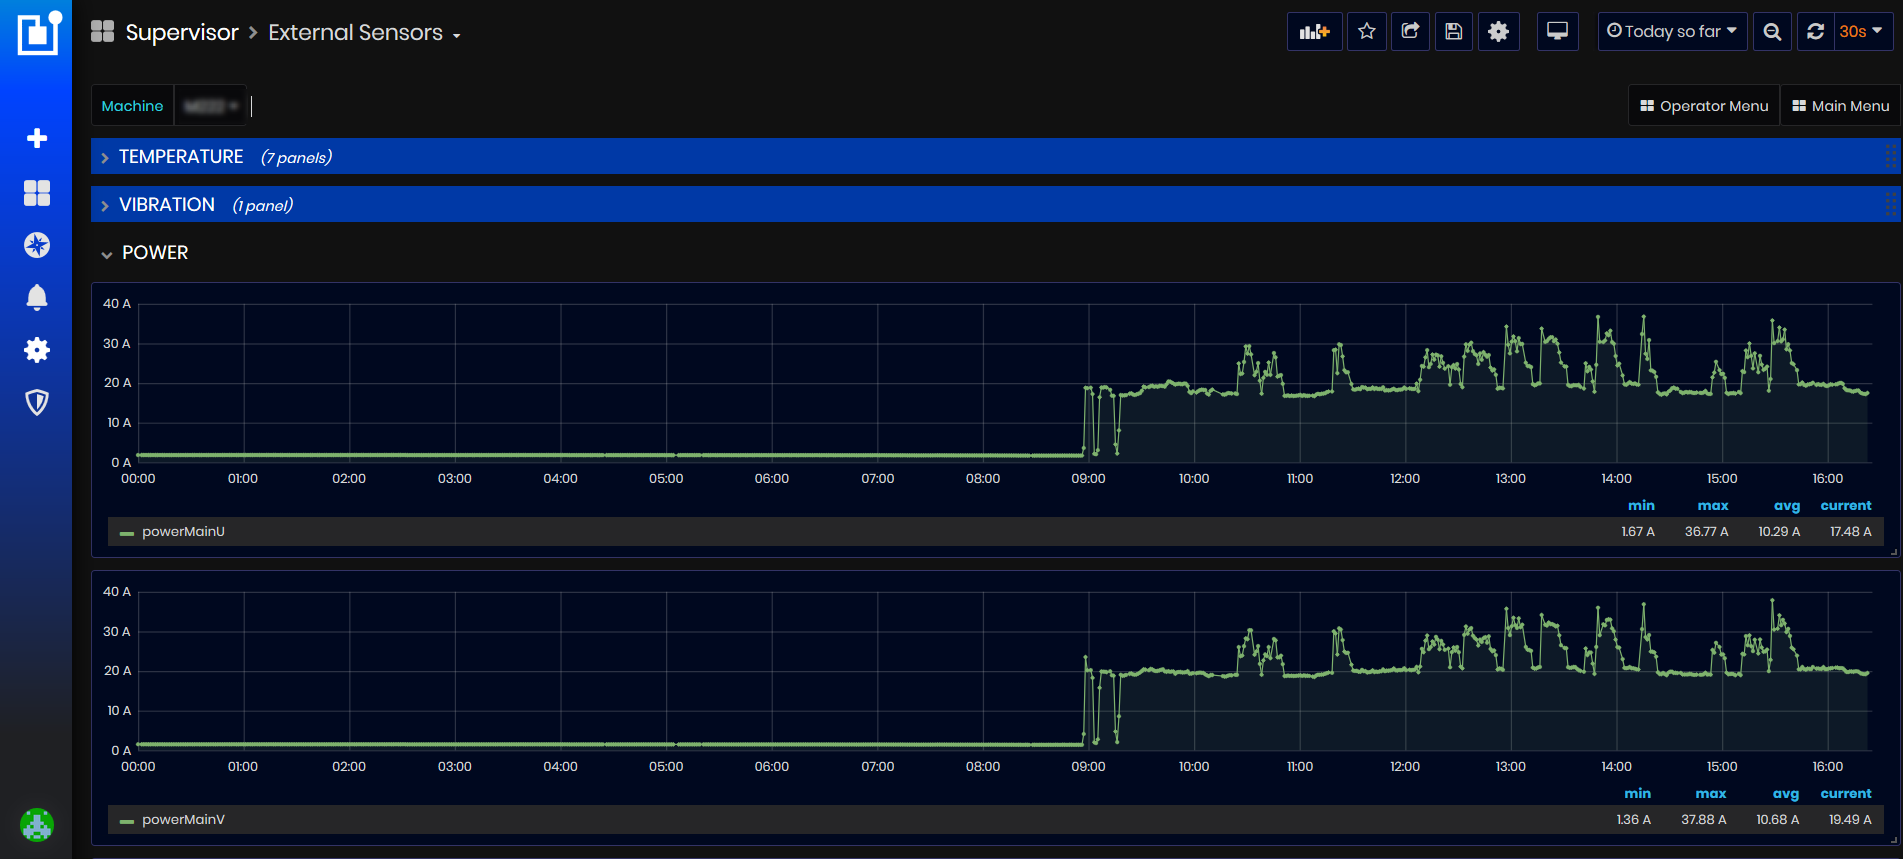
Figure 10: Chart with various temperatures over time
The legend shows minimum, maximum, range, mean, and last temperatures for the selected time period.
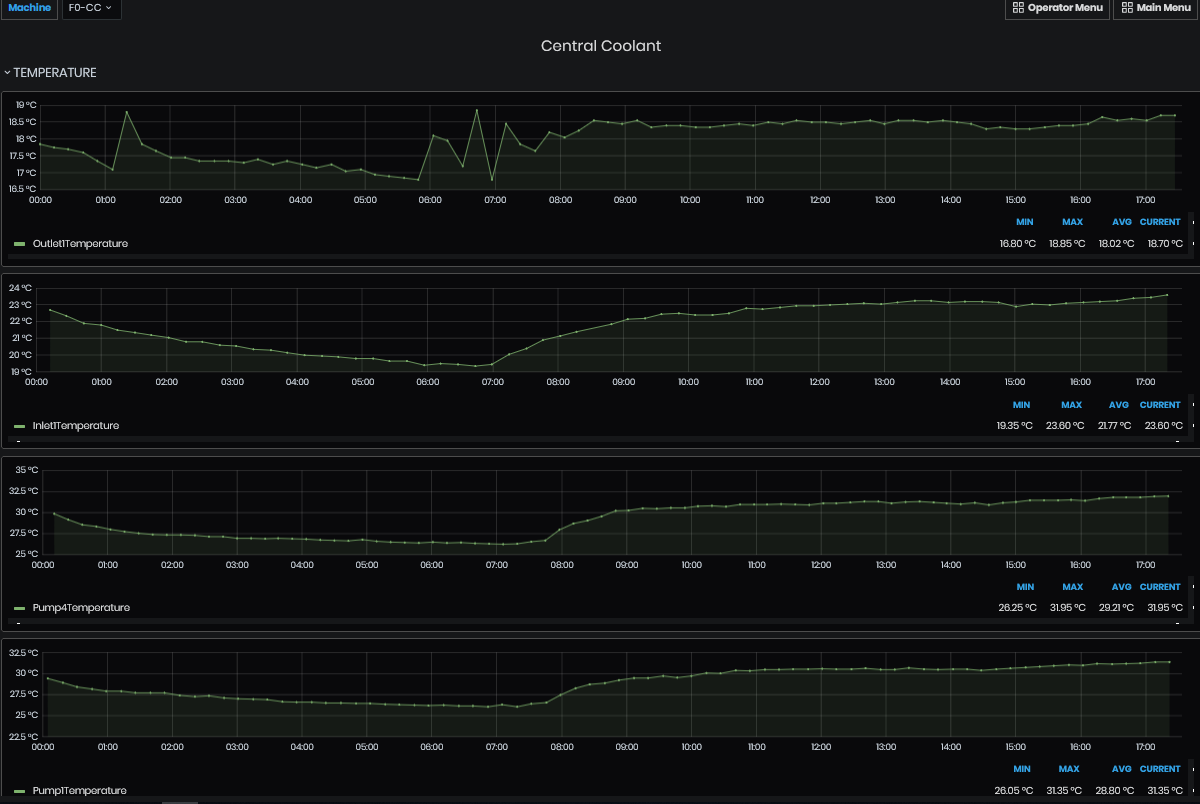
Figure 11: Chart with measured machine power over time
The legend shows minimum, maximum, average, and current values for the selected time period.
To view the configuration of a tag with an external sensor, go to Add Tag with External sensor
Maintenance Requests (Basic)
This dashboard is meant to provide operator users access to creating basic maintenance requests. The dashboard button can be found under the Main Menu/Operator
The dashboard is split logically in three sections (Figure 1):
- Context controls - located at the top, this part provides dropdown selection lists for machine and requests severity level. These give the context of the request
- Request - located at the left, this part provides a panel for submitting a maintenance request in the form of a short message regarding the selected context abode
- Active requests - located at the right, this part provides a table panel for reviewing the currently active request for the given context above
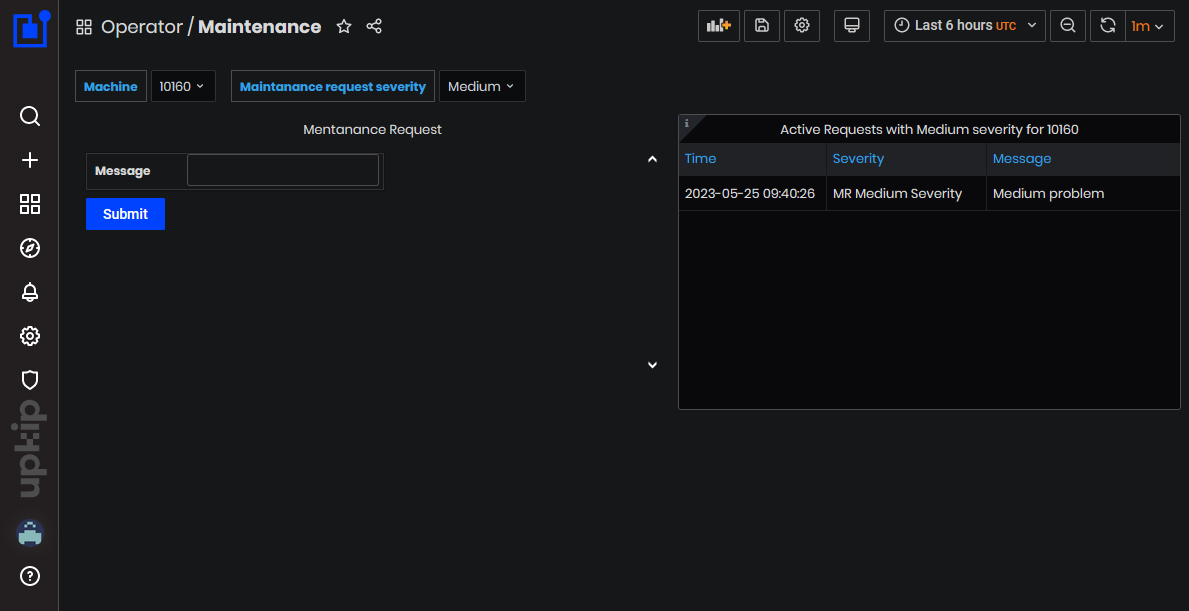
Figure 12: Maintenance request dashboard
Submit a Request
To submit a request simply:
- Select the target machine
- Choose the severity of the problem
- Write a short message
- Click on the Submit button
Note
Maintenance requests are managed in groups split based on Severity. Multiple maintenance requests could be submitted for each Severity group. Thus a client could report multiple issues for maintenance which all will be considered active until cleared.
When a request is submitted the following important actions take place:
- the requests is processed within the next 10-20 seconds
- it will be listed in the Active requests section on this dashboard
- it will be registered as an Active Alarm for the target machine
- it will also be accessible by the Client's Service Company organization which can initiate appropriate actions
- configured notifications will be sent to the interested parties based on the severity of the request
Clear Active Maintenance Requests
After the reported problem has been resolved the Client must clear the maintenance by sending the system message "Normal" for the target Severity. This gives the means to manage multiple maintenance requests in parallel based on the severity.
Example:
- Submit two requests with severity Medium for machine 1
- Submit one request with severitu Low for machine 1
- At this point for machine 1 there will be three active maintenance requests: one with low severity and two with medium severity
- After the low severity issue is resolved, submit "Normal" as message for severity Low
- Low severity requests are cleared. Now for machine 1 there will only two active maintenance requests with medium severity
- After they have also been resolved, submit "Normal" as message for severity Medium
- All maintenance requests have been cleared
Maintenance
Maintenance Requests
Click the Maintenance menu button. Click the Requests button.
- The Maintenance Requests dashboard opens.
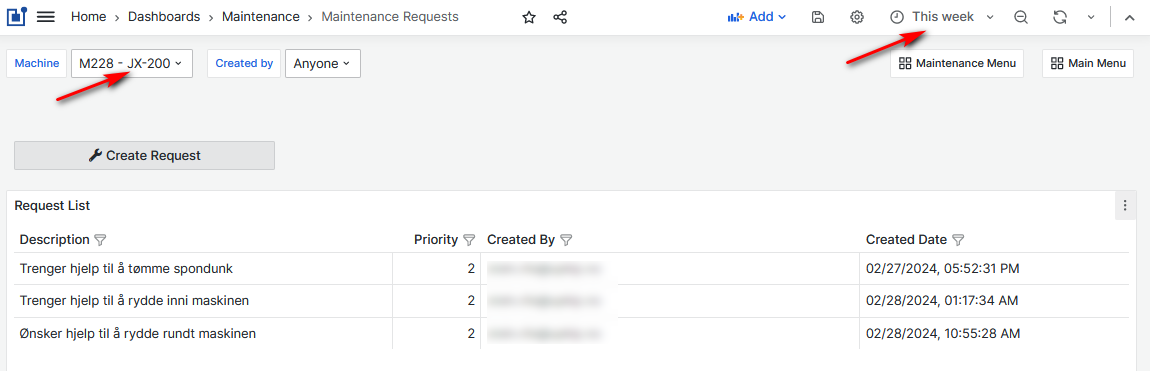
Figure 13: Maintenance Requests dashboard
The dashboard shows submitted maintenance requests for the selected machine and period.
For each request, a description, priority, created by, and created date are displayed.
From the dashboard, users can submit new maintenance requests.
Click the Create Request button.
- A New Maintenance Request form opens.
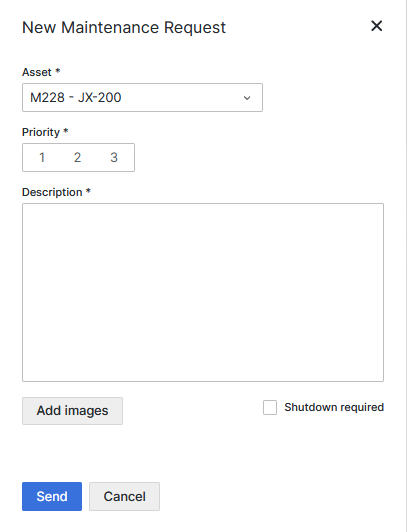
Figure 14: Submit maintenance request from requests dashboard
Select the machine from the drop-down list. Click on the priority, enter description. Optionally add images and click Shutdown required.
Click the Send button.
- The new request is created.
- The created request is visible in the Upkip Adinistration Request menu.
For details, go to the Requests List.
Maintenance Orders
Click the Maintenance menu button. Click the Orders button.
- The Maintenance Orders dashboard opens.
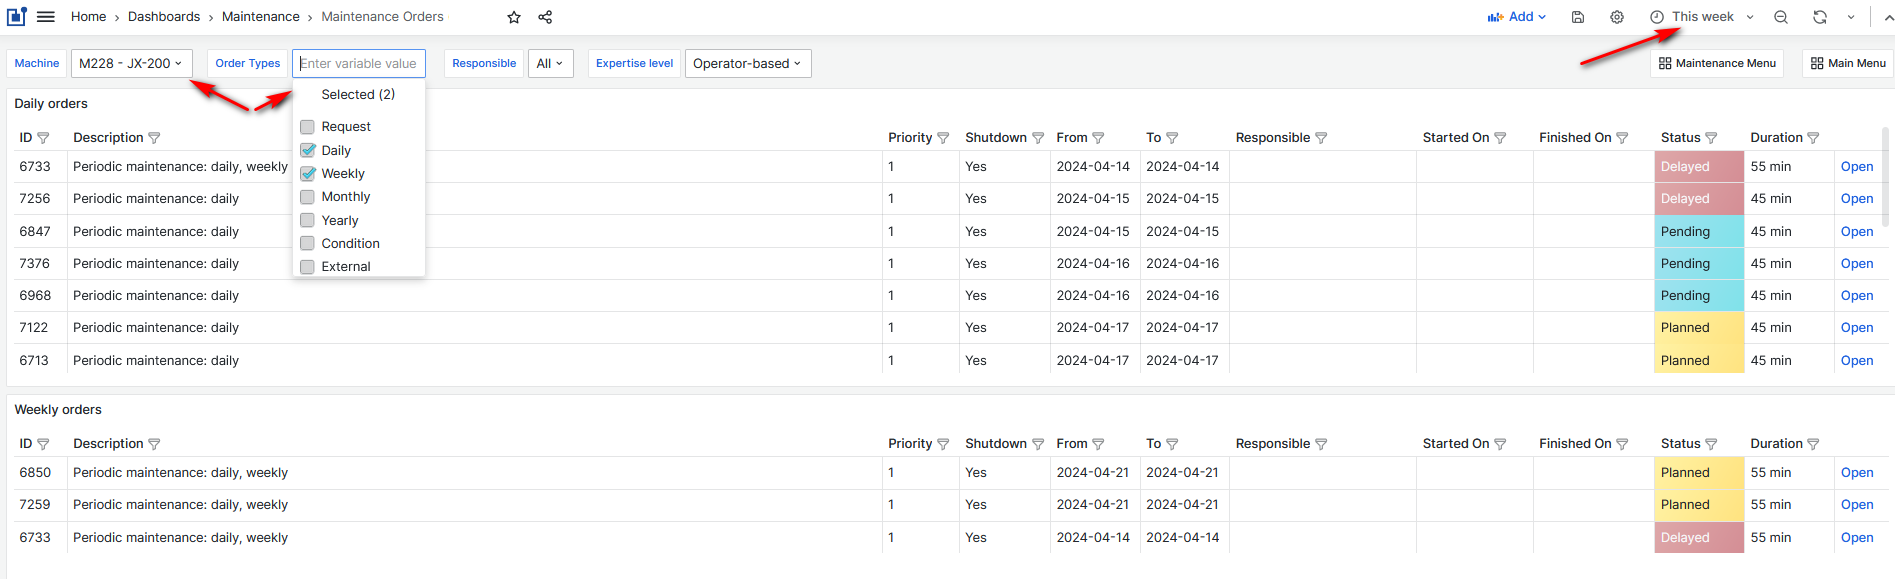
Figure 15: Orders dashboard
Dashboard displays different types of orders for a machine.
Select the machine from the drop-down list. Select the type of orders to display on the dashboard.
From the Order Type filter, it is possible to select daily, weekly, monthly, annual, conditional, and external order types.
- The dashboard shows the type of selected orders, for the selected machine and period.
For each type of order, the following information is displayed: order description, priority, order planned period (from-to), responsible person, duration, and status.
The Shutdown column indicates whether order maintenance requires the machine to shut down.
The Started On and Finished On columns show the actual start and end date and time of the order.
Energy Consumption
The Energy Consumption dashboard shows the readings of the selected electricity meter.
The Consumption for the selected period panel shows:
- Total energy consumption (kWh)
- Day tariff total (kWh)
- Night tariff total (kWh)
Energy consumption per hour (kWh) is shown as a bar graph for the selected period.

Figure 16: Energy consumption for selected period
The Voltage panel shows the last measured voltage values for Phase1, Phase2, and Phase3. The Volate chart shows values of Phase1, Phase2, and Phase3 for a selected period.
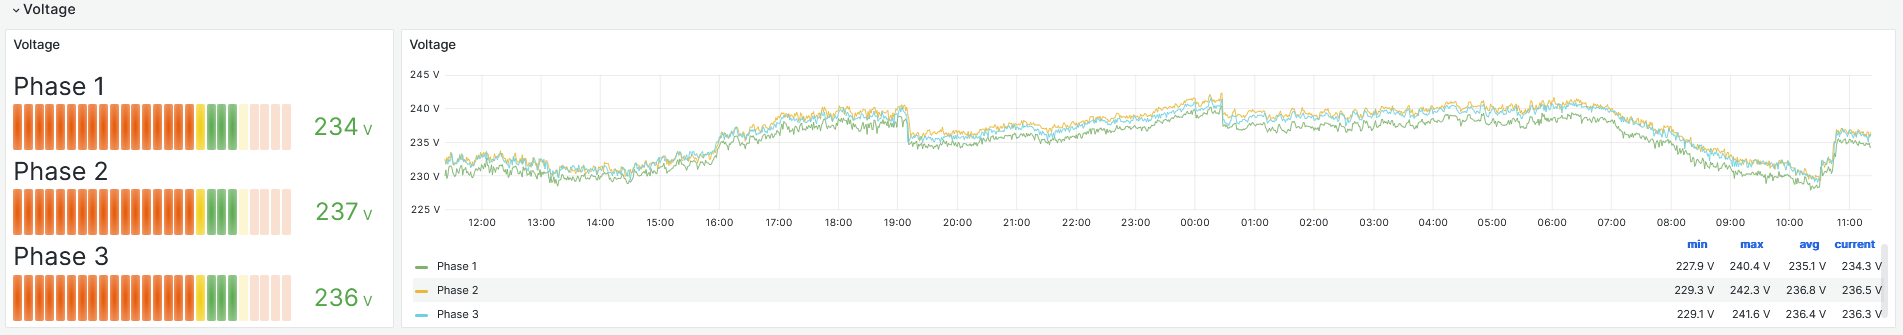
Figure 17: Voltage for selected period
The Current panel shows the last measured current values for Phase1, Phase2, and Phase3. The Current chart shows values of Phase1, Phase2, and Phase3 for a selected period.
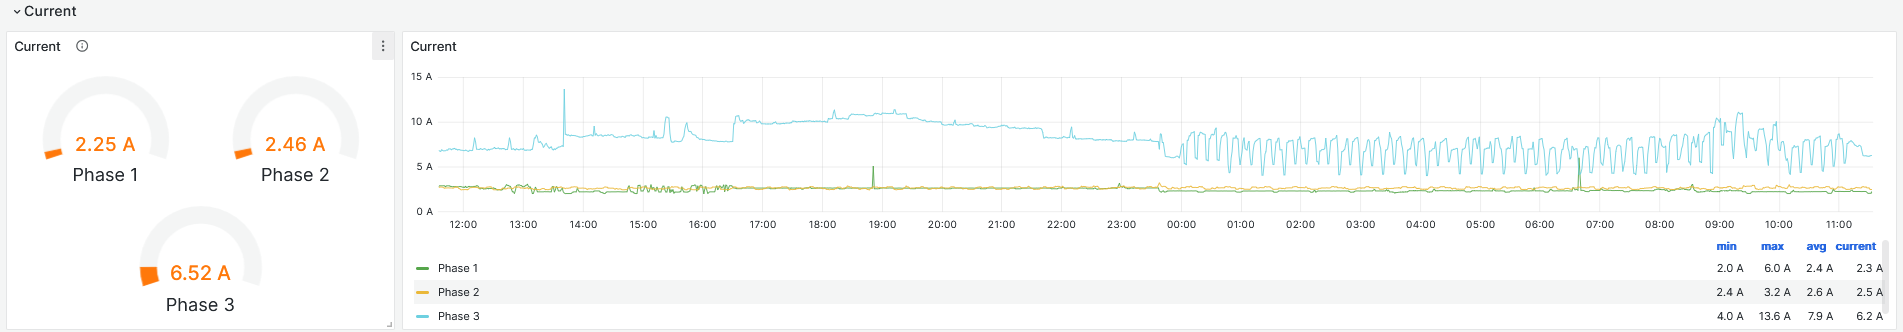
Figure 18: Current for selected period
The Cost panel shows the total electricity cost for the selected period. The Cost per hour chart shows the electricity cost for the selected period.
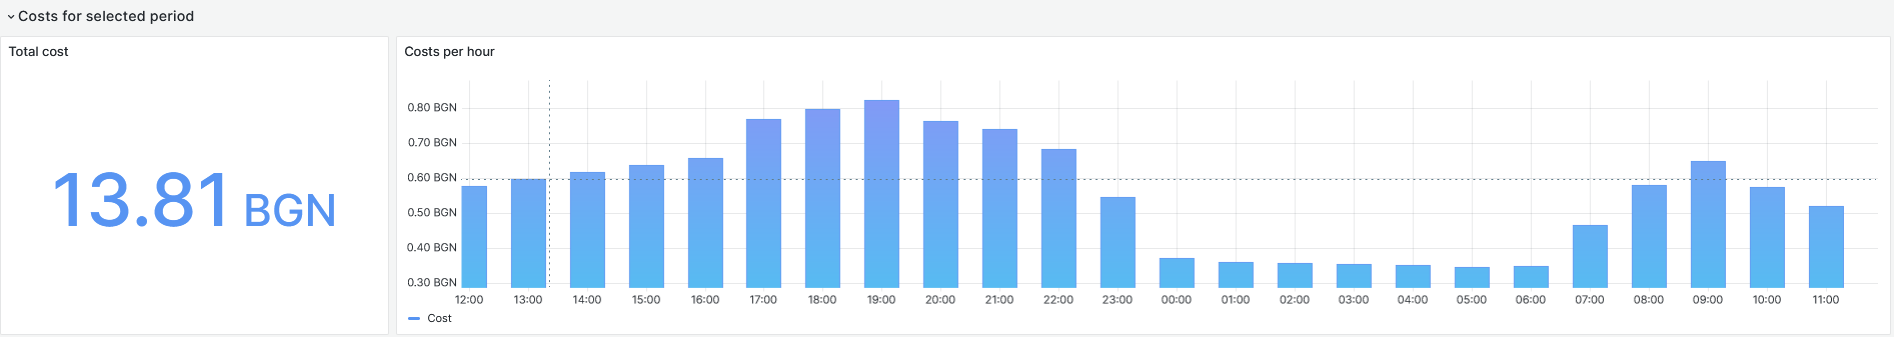
Figure 19: Cost for selected period
The one year consumption and costs panel shows Consumption per week and Cost per week for the last 1 year. Also, Consumption per 30 days and Cost per 30 days for the last 1 year.

Figure 20: Consumption and cost per week or 30 days for one year
The Summary panel shows the total Energy Consumption (kWh), Day Tariff total (kWh), and Night Tariff Total (kWh).

Figure 21: Energy consumption total, day and night tariff total
The Weather panel shows the current temperature and wind speed, the temperature over time for the selected period.
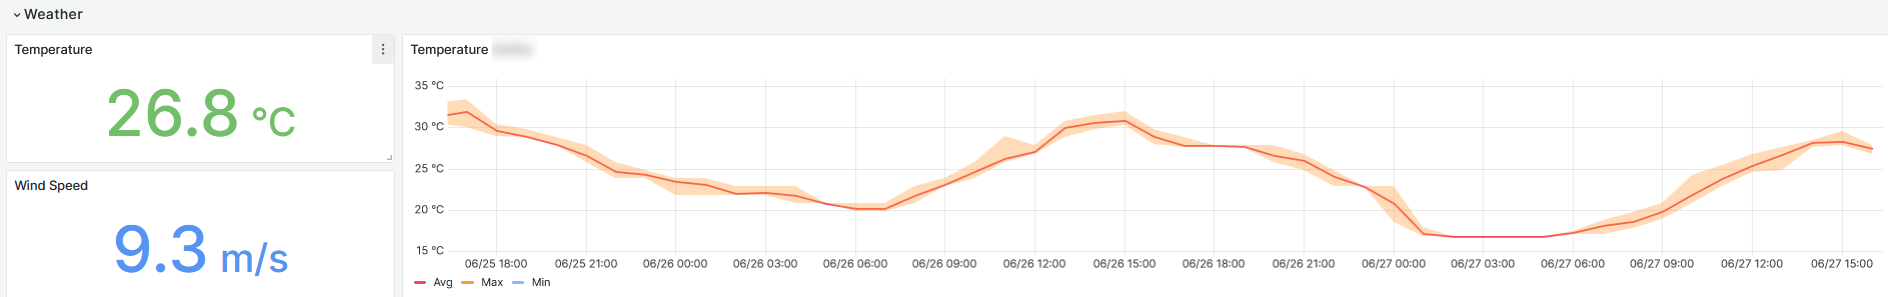
Figure 22: Weather temperature and wind speed
Water Consumption
The Water consumption dashboard shows the consumption of cold and hot water for the selected period.
Select the water meter from the filter.
- The consumption of the selected water meter for the selected period is displayed.

Figure 23: Hot water consumption
The Consumption shows the water consumption (m3) for the selected period.
The Total water consumption is the current reading of the water meter.
The Water consumption per hour chart shows the water consumption (m3) for each hour of the selected period.
Select the cold water meter from the filter and see the consumption of the cold water.
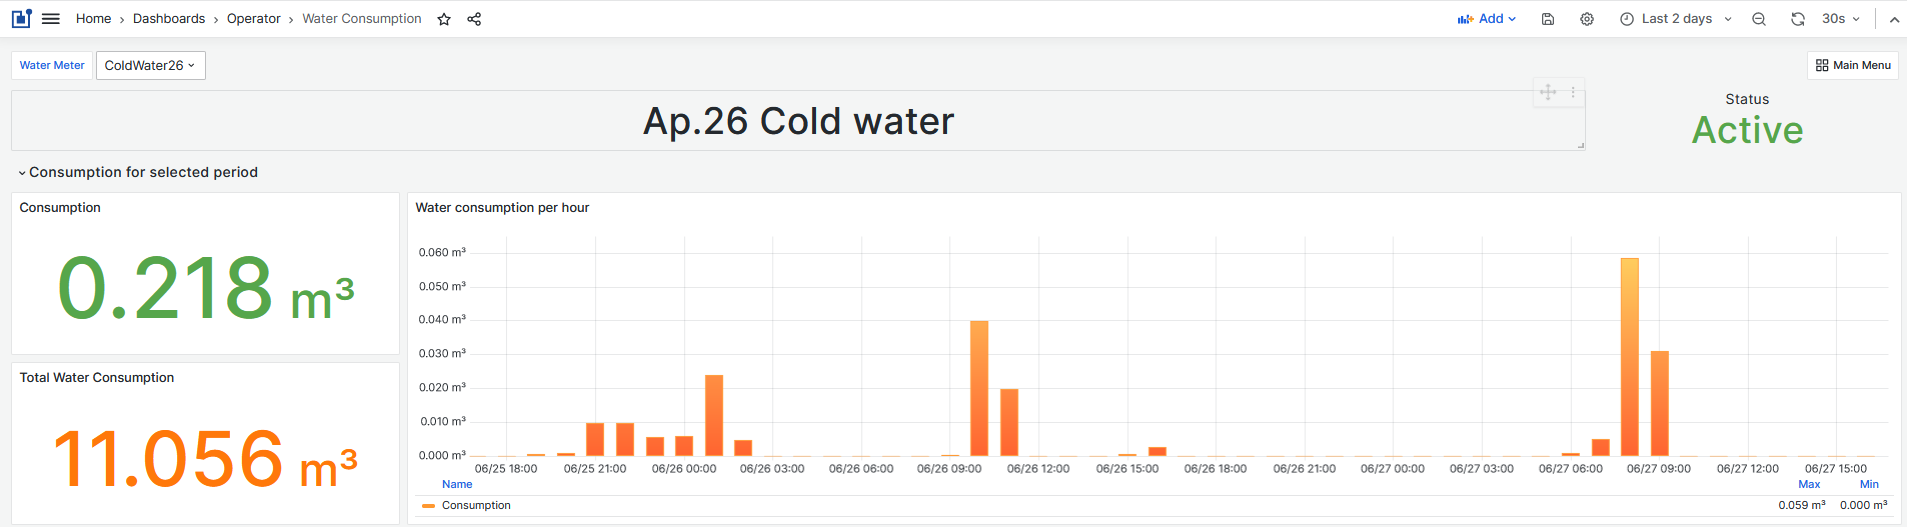
Figure 24: Cold water consumption